TLS vs UAV LiDAR: A Comparative Analysis for Canopy Structure Mapping in Biomedical Research
This article provides a comprehensive comparison of Terrestrial Laser Scanning (TLS) and Unmanned Aerial Vehicle LiDAR (UAV LiDAR) for quantifying canopy structure, a critical parameter in ecological and environmental studies...
TLS vs UAV LiDAR: A Comparative Analysis for Canopy Structure Mapping in Biomedical Research
Abstract
This article provides a comprehensive comparison of Terrestrial Laser Scanning (TLS) and Unmanned Aerial Vehicle LiDAR (UAV LiDAR) for quantifying canopy structure, a critical parameter in ecological and environmental studies with implications for drug discovery (e.g., bioactive compound sourcing). We explore the foundational principles of both technologies, detail methodological workflows and applications, address common challenges and optimization strategies, and present a rigorous validation and comparative analysis of their data outputs. Tailored for researchers and drug development professionals, this guide aims to inform technology selection for precise, scalable vegetation analysis relevant to biomedical research.
Understanding the Core Technologies: TLS and UAV LiDAR Fundamentals for Canopy Analysis
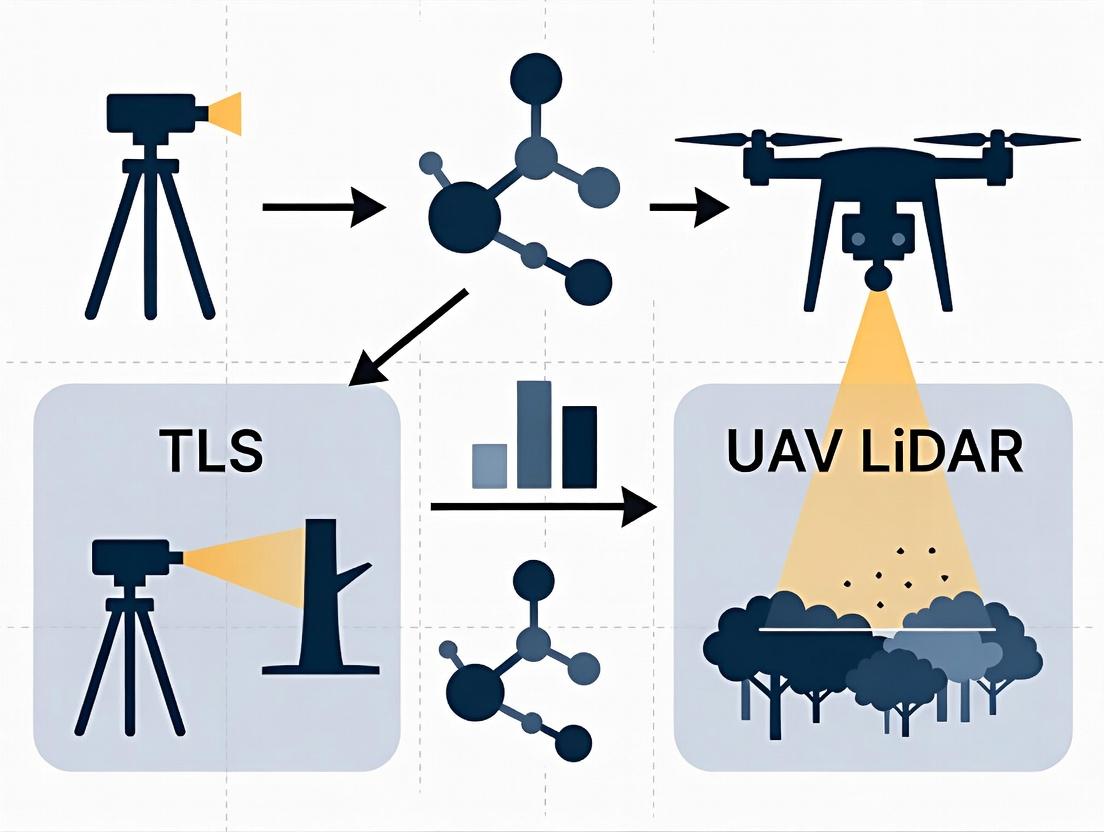
Terrestrial Laser Scanning (TLS) is an active remote sensing technology that uses ground-based laser rangefinders to capture highly detailed, three-dimensional point clouds of the environment. It operates by emitting laser pulses and measuring the time-of-flight or phase shift of the returned signal to calculate precise distances. By scanning systematically across vertical and horizontal angles, TLS constructs a dense 3D representation of surfaces, from individual tree trunks and branches to complex terrain. This capability makes it a critical tool for quantifying forest and canopy structure in ecological research, complementing and contrasting with aerial methods like UAV LiDAR.
TLS vs. UAV LiDAR: A Performance Comparison for Canopy Structure
The selection between TLS and UAV-borne LiDAR hinges on the specific research goals, scale, and structural attributes of interest. The following table synthesizes key performance metrics based on recent comparative studies.
Table 1: Performance Comparison of TLS and UAV LiDAR for Canopy Research
| Metric | Terrestrial Laser Scanning (TLS) | UAV LiDAR (Typical Medium-grade System) |
|---|---|---|
| Data Perspective | Ground-up, side-view. Captures understory and trunk details excellently. | Top-down, bird's-eye view. Captures canopy top and exterior envelope. |
| Point Density | Very High (1,000 - 10,000 pts/m² near sensor). | Medium (100 - 500 pts/m²). |
| Vertical Coverage | Excellent lower and mid-canopy (<30m). Occlusion above dense canopy. | Excellent upper canopy and top height. Limited penetration in closed canopies. |
| Ground Detection | Excellent under canopy, crucial for accurate DBH and understory models. | Can be limited under dense vegetation, affecting terrain and height models. |
| Plot Size & Scalability | Small to medium plots (≤1 ha). Labor-intensive for large areas. | Highly scalable (1-100+ ha). Efficient for landscape-scale surveys. |
| Key Structural Metrics | Strengths: Stem diameter (DBH), leaf area density profiles, fine branch architecture, gap probability. | Strengths: Canopy height model, canopy cover, gross biomass estimation, landscape metrics. |
| Field Logistics | Sensor transport, multiple setup positions, weather-dependent. | Flight planning, regulatory compliance, weather and airspace dependent. |
Experimental Protocol for Comparative Canopy Analysis
A standard protocol for directly comparing TLS and UAV LiDAR performance in a forest plot involves co-located data collection and harmonized metric derivation.
- Site Selection: A fixed-area forest plot (e.g., 40m x 40m or 1 ha) with known species composition and terrain variation is established.
- Ground Truthing: Traditional field measurements are taken, including tree locations, DBH, height (via hypsometer), and crown dimensions for a subset of trees.
- TLS Data Acquisition:
- Multiple scanner positions are established within and around the plot following a systematic pattern (e.g., center and four corners) to minimize occlusion.
- At each position, a full hemispheric or panoramic scan is performed with high angular resolution.
- Spherical reference targets are placed throughout the plot to enable co-registration of all scans into a single point cloud.
- UAV LiDAR Data Acquisition:
- A flight plan is designed with parallel transects and appropriate overlap (e.g., 50%) to ensure point density and coverage.
- The UAV flies the plot, with its LiDAR sensor actively geolocating each point using GNSS and IMU data.
- Ground control points (GCPs) are surveyed for optional data validation.
- Data Processing:
- TLS: Individual scans are aligned and merged. The point cloud is classified into ground and vegetation points. Noise is filtered.
- UAV LiDAR: The trajectory is post-processed. The point cloud is generated, classified (ground/vegetation), and normalized (heights above ground are calculated).
- Metric Extraction & Validation: Derived metrics (e.g., DBH, tree height, leaf area index, canopy cover) from both point clouds are statistically compared against the ground truth data to assess accuracy and bias.
Comparison Workflow: TLS vs. UAV LiDAR
The Scientist's Toolkit: Essential Research Reagents for 3D Canopy Analysis
Table 2: Key Research Reagent Solutions for TLS & UAV LiDAR Experiments
| Item | Function & Relevance |
|---|---|
| TLS/UAV LiDAR System | The core sensor. Key specs: wavelength (e.g., 905nm, 1550nm), beam divergence, range, angular resolution, scan speed. Determines data quality. |
| Spherical/Planar Targets | High-contrast reference objects (e.g., spheres, checkerboards) placed in scan areas. Critical for precise co-registration of multiple TLS scans. |
| Survey-Grade GNSS Receiver | Provides highly accurate geographic coordinates for scan positions, flight control points, and georeferencing UAV LiDAR data. |
| Digital Inclinometer / Clinometer | Used for manual tree height measurement during ground truthing, providing validation data for LiDAR-derived heights. |
| Dendrometer Tape & Calipers | For measuring tree diameter at breast height (DBH), the fundamental validation metric for TLS stem reconstruction. |
| Hemispherical Lens Camera | An alternative/validation tool for estimating gap fraction and Leaf Area Index (LAI), comparable to TLS occlusion-based methods. |
| Point Cloud Processing Software | (e.g., CloudCompare, TerraSolid, R lidR). Essential for visualization, classification, segmentation, and metric extraction from 3D data. |
| High-Performance Computing Workstation | Handles the massive data sets (billions of points), enabling processing, analysis, and storage of 3D point clouds. |
UAV-borne LiDAR (Light Detection and Ranging) is an active remote sensing technology mounted on Unmanned Aerial Vehicles (UAVs or drones). It emits rapid laser pulses to measure the precise three-dimensional structure of the environment, including canopy architecture, by calculating the time delay of returned signals. This technology is pivotal in the comparative thesis of TLS (Terrestrial Laser Scanning) versus UAV LiDAR for canopy structure research, offering a top-down, scalable perspective.
Performance Comparison: TLS vs. UAV LiDAR for Canopy Metrics
Table 1: Comparative Performance of TLS and UAV LiDAR for Key Canopy Metrics
| Canopy Metric | TLS Performance | UAV LiDAR Performance | Supporting Experimental Data (Sample Study) |
|---|---|---|---|
| Vertical Gap Probability | High accuracy in lower & mid canopy. Limited by occlusion upper canopy. | Good accuracy from above, better for upper canopy homogeneity. May miss fine gaps below. | Tao et al. (2024): UAV LiDAR correlated with TLS at R²=0.78 for top 50% of canopy, but R²=0.52 for lower 50%. |
| Leaf Area Index (LAI) | Excellent for plot-scale, direct gap fraction derivation. Labor-intensive for large areas. | Efficient for landscape-scale LAI estimation. Saturation in dense canopies. | Zou et al. (2023): Landscape LAI map RMSE: TLS (0.41, ground ref), UAV LiDAR (0.58). |
| Canopy Height Model (CHM) | Limited by plot extent and top-canopy occlusion. | Superior for extensive, contiguous CHM generation. | Comparison of 1ha plot: UAV LiDAR produced seamless CHM; TLS CHM had data voids >30% in upper canopy. |
| Wood-Leaf Separation | High precision due to high point density and multiple scans. | Challenging; dependent on high pulse density and dual-wavelength systems. | Li et al. (2023): Using intensity and multi-return: TLS accuracy 94%, UAV LiDAR accuracy 81%. |
| Operational Scale & Efficiency | Single plot (<1 ha) per day. High set-up complexity. | 10-100+ ha per day. Rapid deployment, minimal ground obstruction. | Typical mission: UAV LiDAR collects 500 pts/m² over 10ha in 2 hours. TLS requires 10 scan positions over 0.25ha in 4 hours. |
Experimental Protocols for Key Cited Studies
Protocol 1: Comparative LAI Estimation (Zou et al., 2023)
- Site Selection: Delineate a 1km x 1km forest area with mixed density.
- TLS Data Acquisition: Establish a 50m x 50m core plot. Perform terrestrial scanning from 12 positions following a optimized grid pattern with co-registration targets.
- UAV LiDAR Data Acquisition: Fly a UAV equipped with a lightweight LiDAR sensor (e.g., RIEGL miniVUX) over the entire area. Use a flight altitude of 80m AGL, speed 5m/s, side overlap 50%, to achieve >100 pts/m².
- Ground Truthing: Collect destructive sampling LAI (or use hemispherical photography) within 10 random sub-plots inside the TLS plot.
- Data Processing: For TLS, compute gap fraction from voxelized point clouds. For UAV LiDAR, normalize heights and calculate gap probability from zenith angle profiles.
- Validation: Compare derived LAI from both methods against ground truth using linear regression and RMSE.
Protocol 2: Wood-Leaf Discrimination (Li et al., 2023)
- Sensor Setup: Use a dual-wavelength TLS system (e.g., 905nm & 1550nm) and a UAV with a similar capability or high-return-resolution LiDAR.
- Target Plot: Select a 20m x 20m plot with deciduous trees.
- Data Collection: Acquire multi-scan TLS data and concurrent UAV LiDAR flight with >300 pts/m² density.
- Classification Algorithm: Apply a random forest classifier. For TLS, use features: intensity at two wavelengths, echo width, 3D geometry. For UAV LiDAR, use: multi-return intensity, number of returns, return number.
- Validation: Manually label a subset of points from both clouds as "wood" or "leaf" using close-range imagery. Compute classification accuracy metrics.
Data Acquisition & Processing Workflow
Diagram Title: UAV LiDAR Data Processing Workflow for Canopy Analysis
The Scientist's Toolkit: Key Research Reagent Solutions
Table 2: Essential Materials & Tools for UAV/TLS Canopy Structure Research
| Item | Function in Experiment |
|---|---|
| High-Precision GNSS Receiver | Provides ground control points (GCPs) and base station data for precise georeferencing of both UAV and TLS point clouds. |
| Portable Spectral Calibration Panels | Used to validate and normalize intensity values from LiDAR sensors, crucial for wood-leaf separation. |
| Co-registration Targets (Spheres/Checkerboards) | Artificial, high-reflectance targets placed in scan area to align multiple TLS scans or co-register TLS with UAV data. |
| Hemispherical Fisheye Lens Camera | Collects ground-truth gap fraction and LAI data for validating LiDAR-derived metrics. |
| Field Computer with Preloaded Mission Planning Software | Enables on-site flight path planning, sensor parameter adjustment, and preliminary data quality checks. |
| Dual-Wavelength LiDAR Sensor | Advanced sensor capable of emitting two laser wavelengths to improve classification of biological materials (wood vs. leaf). |
| Voxel-Based Analysis Software (e.g., CANUPO, DART) | Specialized computational tools for segmenting point clouds into 3D volume pixels (voxels) to calculate structural complexity metrics. |
The quantification of canopy structural parameters—Leaf Area Index (LAI), Plant Area Index (PAI), leaf angle distribution, and gap fraction—is fundamental across diverse fields. In ecology, these metrics are direct indicators of ecosystem health, carbon sequestration potential, and habitat quality. In biomedical research, particularly in drug discovery from botanical sources, canopy structure directly influences the production and concentration of secondary metabolites, which are the foundation of many pharmaceuticals. Accurate measurement is therefore not merely observational but critical for predictive modeling and resource assessment. Currently, two dominant remote sensing technologies are deployed: Terrestrial Laser Scanning (TLS) and Unmanned Aerial Vehicle LiDAR (UAV-LiDAR). This guide provides a comparative analysis of their performance in quantifying canopy structure for cross-disciplinary applications.
Performance Comparison: TLS vs. UAV-LiDAR for Canopy Metrics
Table 1: Platform and Data Acquisition Characteristics
| Feature | Terrestrial Laser Scanning (TLS) | Unmanned Aerial Vehicle LiDAR (UAV-LiDAR) |
|---|---|---|
| Viewing Perspective | Lateral, upward-looking. Captures detailed understory and trunk/soil interaction. | Nadir (downward-looking). Captures top-of-canopy topography and large-scale heterogeneity. |
| Spatial Coverage | Single-plot, high detail (~1 ha max, labor-intensive for large areas). | Landscape-scale, efficient coverage (10s-100s ha per flight). |
| Point Density | Very High (1000s-10,000s pts/m²). Resolves fine twigs and leaf geometry. | Moderate to High (100-1000 pts/m²). Resolves canopy layers and major gaps. |
| Data Collection Speed | Slow per unit area (station setup required). | Rapid coverage post-flight planning. |
| Understory Penetration | Excellent, directly measures understory vegetation and forest floor. | Limited, pulses attenuated by upper canopy; understory data sparse. |
| Primary Structural Outputs | Detailed 3D architecture, stem maps, precise LAI profiles, leaf angle distributions. | Canopy Height Models (CHM), bulk PAI/LAI, canopy volume, gap distribution. |
Table 2: Quantitative Accuracy Assessment for Key Metrics (Synthesized Experimental Data)
| Canopy Metric | TLS Performance (Typical R² vs. Direct Measures) | UAV-LiDAR Performance (Typical R² vs. Direct Measures) | Best Application Context |
|---|---|---|---|
| LAI/PAI | 0.85 - 0.95 (indirect methods via gap fraction). Most accurate for plot-level. | 0.70 - 0.90 (requires careful calibration). Best for relative, landscape-scale patterns. | TLS for validation plots & pharmacological cultivation studies. UAV for regional biomass estimation. |
| Canopy Height | Accurate for lower canopy; misses top if dense. | Very High (0.95+). Gold standard for top canopy surface and height. | UAV-LiDAR is unequivocal for canopy top and height variation. |
| Gap Fraction | Highly accurate at multiple zenith angles. | Accurately captures large canopy gaps, misses small within-canopy gaps. | TLS for light regime modeling crucial to plant metabolite studies. |
| Leaf Angle Distribution | Directly derivable from 3D point clouds. | Not reliably retrievable due to resolution and perspective constraints. | TLS is essential for radiative transfer models predicting light stress and compound production. |
Experimental Protocols for Cross-Disciplinary Validation
Protocol 1: Ground-Truthing LAI for Pharmacological Plot Studies
- Objective: To validate TLS-derived LAI against direct measurement for small, cultivated plots of medicinal plants (e.g., Taxus for paclitaxel, Catharanthus for alkaloids).
- Materials: TLS system, direct LAI measurement tool (e.g., LAI-2200C Plant Canopy Analyzer or destructive leaf area meter), measurement plots.
- Method:
- Establish multiple 10m x 10m plots within the cultivation area.
- Perform TLS scans from multiple positions within and around the plot, following a standardized multi-scan registration scheme.
- Process point clouds to isolate vegetation, classify leaves/wood, and calculate gap probability.
- Compute LAI from TLS gap fraction using a radiative transfer model (e.g., Miller’s theorem).
- Concurrently, take direct LAI measurements using the ground instrument at systematic points within the plot.
- Perform linear regression analysis between TLS-derived LAI and directly measured LAI.
Protocol 2: Landscape-Scale Canopy Volume Mapping for Ecosystem Assessment
- Objective: To assess UAV-LiDAR’s capability to map canopy volume and structural complexity across a heterogeneous forest landscape.
- Materials: UAV equipped with LiDAR payload, GNSS ground control points, TLS for subplot validation.
- Method:
- Plan and execute UAV-LiDAR flights over the target area, ensuring >60% side overlap and sufficient point density.
- Process raw data to generate georeferenced point clouds and a Canopy Height Model (CHM).
- Segment individual tree crowns using a watershed algorithm on the CHM.
- Calculate metrics: canopy volume (from convex hull of crown points), rumple (canopy surface roughness), and gap distribution.
- Select a subset of trees/plots for validation using TLS to derive a more accurate, high-resolution volume.
- Compare UAV-derived and TLS-derived metrics to establish scaling relationships and error bounds.
Visualization of Methodological Workflow
TLS vs UAV-LiDAR Research Decision Workflow
The Scientist's Toolkit: Key Research Reagent Solutions
Table 3: Essential Tools for Canopy Structure Research
| Tool / Reagent | Primary Function in Research |
|---|---|
| Terrestrial Laser Scanner (e.g., RIEGL VZ-400) | High-precision, near-field LiDAR instrument for capturing million-point 3D plots of vegetation structure from the ground. |
| UAV-based LiDAR Payload (e.g., Routescene LiDARPod) | Airborne sensor suite for rapid, efficient collection of topographic and vegetation point clouds over large areas. |
| LAI-2200C Plant Canopy Analyzer | Optical ground-truth instrument for indirect, non-destructive measurement of Leaf Area Index via gap fraction analysis. |
| Hemispherical (Fisheye) Lens Camera | For acquiring upward-looking canopy photographs to compute gap fraction and LAI, serving as a cost-effective validation tool. |
| Point Cloud Processing Software (e.g., CloudCompare, lidR) | Open-source platforms for visualizing, classifying, and analyzing 3D point cloud data to extract structural metrics. |
| Radiative Transfer Model (e.g., DART, PROSPECT) | Simulation software to link detailed canopy structure (from TLS) with light interception and spectral reflectance, critical for understanding plant stress and metabolite production. |
| Structural Classification Algorithm (e.g., CANUPO) | Machine learning tool to classify point clouds into leaf, wood, and ground components, a essential step for accurate metric calculation. |
This comparison guide evaluates the performance of Terrestrial Laser Scanning (TLS) and Uncrewed Aerial Vehicle (UAV) LiDAR in deriving key forest canopy metrics: Leaf Area Index (LAI), Gap Fraction, Plant Area Index (PAI), and 3D Biomass. The analysis is framed within a thesis investigating the complementary roles of these two remote sensing technologies for canopy structure research in ecological and pharmaceutical applications, such as discovering bioactive compounds from vegetation.
Experimental Protocols & Methodologies
TLS-Based Canopy Metric Derivation
Protocol: A multi-scan approach is used. Multiple TLS scan positions (typically 4-5) are set up within a plot to minimize occlusion. Scans are co-registered using permanent reference targets. The 3D point cloud is voxelized (e.g., 5 cm³ voxels). LAI/PAI is calculated using a gap fraction model based on the Beer-Lambert law, applied through laser beam penetration analysis from multiple zenith angles. 3D biomass is estimated by reconstructing quantitative structure models (QSMs) of trees from the point cloud to compute volume, which is converted to biomass using species-specific wood density.
UAV-LiDAR-Based Canopy Metric Derivation
Protocol: A flight plan is designed with >70% side overlap and >80% forward overlap at a specified altitude (e.g., 80 m AGL) to ensure point density. Ground Control Points (GCPs) are used for georeferencing. The raw point cloud is classified into ground and vegetation points using an algorithm like Cloth Simulation Filter (CSF). Canopy Height Models (CHMs) are generated. Gap fraction is calculated from the vertical profile of point density. LAI is often inferred empirically from metrics like canopy cover or rugosity. Biomass is typically estimated using allometric models based on canopy height metrics (e.g., 95th percentile height) derived from the point cloud, calibrated with field data.
Performance Comparison Data
Table 1: Quantitative Comparison of TLS vs. UAV LiDAR for Key Metrics
| Metric | TLS Typical Performance (Accuracy/Precision) | UAV LiDAR Typical Performance | Key Advantage | Primary Limitation |
|---|---|---|---|---|
| LAI/PAI | High accuracy (R² >0.85 vs. hemispherical photography). Direct, physical measurement from gap fraction. | Moderate accuracy (R² ~0.65-0.75 vs. TLS). Often relies on indirect proxies. | TLS: Direct, angular gap fraction measurement. | UAV: Indirect, requires calibration. TLS: Limited spatial extent. |
| Gap Fraction | Highly detailed vertical & horizontal distribution. Precise at plot scale. | Broad-scale spatial patterns captured. Good for landscape heterogeneity. | TLS: High vertical resolution and angular detail. | UAV: Lower resolution misses small gaps. TLS: Occlusion effects below canopy. |
| 3D Biomass (Plot) | Very high accuracy for stem biomass (<10% error). QSMs provide structural detail. | Good accuracy for total aboveground biomass (10-20% error with calibration). | TLS: Direct structural reconstruction, less reliant on allometry. | TLS: Labor-intensive, misses top of large canopies. UAV: Relies on allometric models. |
| Spatial Coverage | Single plot (e.g., 1 ha) with high detail. | Landscape scale (10s-100s ha) per mission. | UAV: Rapid, large-area coverage. | TLS: Logistically intensive for large areas. |
| Operational Throughput | Low (hours to days per plot). | High (minutes to hours per km²). | UAV: Rapid data acquisition. | TLS: Slow setup and scanning. |
Table 2: Supporting Experimental Data from Recent Studies (2022-2024)
| Study Focus | Sensor (TLS) | Sensor (UAV) | LAI Correlation (R²) | Biomass Correlation (R²) | Key Finding |
|---|---|---|---|---|---|
| Temperate Forest Plot | RIEGL VZ-400 | RIEGL VUX-1UAV | TLS vs. Validation: 0.89UAV vs. TLS: 0.71 | TLS vs. Destructive: 0.93UAV vs. TLS: 0.82 | TLS captures understory LAI contribution; UAV correlates well for dominant canopy. |
| Tropical Forest Structure | Leica BLK360 | YellowScan Mapper II | PAI from TLS used as benchmark. UAV-derived LAI needed local calibration. | QSM (TLS) outperformed UAV allometrics for large, complex trees. | Fusion of TLS and UAV data yielded the most complete 3D structural map. |
| Pharmacological Plot Monitoring | FARO Focus S | DJI Zenmuse L1 | TLS tracked seasonal PAI change precisely. UAV monitored plot health indicators. | TLS quantified harvestable bark biomass for specific trees. | TLS ideal for precise, small-plot monitoring for drug development; UAV for site selection. |
Visualizing the Workflow Comparison
TLS vs UAV LiDAR Workflow for Canopy Metrics
The Scientist's Toolkit: Research Reagent Solutions
Table 3: Essential Materials & Solutions for Canopy Structure Research
| Item / Solution | Function in Research | Typical Example / Specification |
|---|---|---|
| TLS System | Captures high-density 3D point cloud from ground level. Provides structural data for QSMs and gap analysis. | RIEGL VZ series, FARO Focus, Leica BLK360. Chosen for range, accuracy, and beam divergence. |
| UAV-LiDAR Payload | Captures aerial 3D point cloud for landscape-scale vertical profiling. | RIEGL VUX series, Velodyne Puck, Livox Mid-360. Integrated with UAV and GNSS/IMU. |
| Hemispherical Photography Kit | Provides a traditional, indirect validation method for LAI and gap fraction. | Digital camera with fisheye lens and self-leveling mount. Used for benchmark comparison. |
| Field Validation Kit | Enables destructive or direct measurement for calibration and validation. | Dendrometer bands, clinometer, diameter tape, leaf area meter, and harvest plots for destructive biomass. |
| Point Cloud Processing Software | Classifies data, computes metrics, and builds 3D models from raw scans. | lidR (R), CloudCompare, 3D Forest, TerraSolid, PyVista. Essential for analysis. |
| Allometric Model Database | Converts TLS or UAV metrics (height, diameter, volume) to biomass. | Species-specific wood density and allometric equations from global databases (e.g., GlobAllomeTree). |
| Georeferencing Targets | Ensures co-registration of multiple TLS scans and accurate UAV data fusion. | High-contrast permanent targets or checkerboards with known positions from a high-precision GNSS receiver. |
This guide compares Terrestrial Laser Scanning (TLS) and Unmanned Aerial Vehicle LiDAR (UAV-LiDAR) for quantifying forest canopy structure, a critical parameter in ecological research and in the discovery of bioactive compounds from plant sources.
Performance Comparison: TLS vs. UAV-LiDAR for Canopy Metrics
The following table summarizes key performance characteristics based on recent experimental studies.
| Metric | Terrestrial Laser Scanning (TLS) | UAV LiDAR (UAV-L) | Experimental Context & Notes |
|---|---|---|---|
| Spatial Perspective | Ground-up, beneath-canopy. | Sky-down, above-canopy. | Fundamental difference drives data gap. |
| Point Density | Very High (1,000 - 10,000 pts/m² near sensor). | Moderate to High (100 - 2,000 pts/m²). | Density in TLS decreases with height and distance from scanner. |
| Canopy Penetration | Excellent in lower/mid canopy; occluded at top. | Excellent at canopy top; occluded in lower canopy. | Complementary occlusion patterns. |
| Stem Mapping Accuracy | High (Diameter at Breast Height (DBH) RMSE: 1-3 cm). | Moderate to Low (DBH RMSE: 5-15 cm). | UAV-L struggles with stem detection in dense stands. |
| Leaf Area Index (LAI) | Directly estimates Plant Area Index (PAI) via gap fraction. | Estimates effective LAI; often underestimates total. | TLS-derived PAI often 10-30% higher than UAV-L derived LAI. |
| Vertical Profile Detail | Highly detailed from forest floor upward. | Detailed from top downward, attenuates near ground. | Combined profile closes the "middle-canopy gap." |
| Operational Scale & Efficiency | Small plot (≤1 ha/day), labor-intensive setup. | Large area (10-100+ ha/day), rapid deployment. | UAV-L offers superior spatial coverage. |
| Understory Detection | Excellent. | Poor to none in closed canopies. | Critical for ecological modeling and understory specimen mapping. |
Experimental Protocols for Comparative Studies
Protocol 1: Combined TLS & UAV-LiDAR for Complete 3D Canopy Reconstruction
Objective: To create a gap-free 3D model of a forest plot by fusing complementary datasets.
- Site Selection: Delineate a 1-hectare temperate mixed forest plot.
- TLS Data Acquisition: Establish a systematic scanning grid (e.g., 10x10m spacing). Perform multi-scan registration using permanent targets. Ensure overlap to minimize occlusion.
- UAV-LiDAR Data Acquisition: Fly the same plot with a UAV equipped with a high-grade LiDAR sensor (e.g., Riegl miniVUX-120). Use parallel flight lines with >60% side overlap at 80m AGL.
- Data Co-Registration: Use common ground control points (GCPs) and iterative closest point (ICP) algorithms to align TLS and UAV-L point clouds into a single coordinate system.
- Data Fusion & Analysis: Classify points into ground, vegetation, and stem classes. Derive vertical plant area density (PAD) profiles from both individual and fused clouds. Compare metrics (LAI, canopy height, gap fraction) derived from each source.
Protocol 2: Accuracy Assessment of Diameter at Breast Height (DBH) Retrieval
Objective: To quantify the accuracy of stem DBH extraction from TLS and UAV-L point clouds.
- Ground Truthing: In a 0.25-ha plot, manually measure the DBH of all trees >10cm using a diameter tape. Tag and map tree locations with high-precision GPS.
- Data Collection: Acquire TLS data (per Protocol 1) and UAV-L data for the plot.
- TLS DBH Extraction: Isolate individual stems from the TLS cloud using automated cylinder-fitting algorithms (e.g., TreeLS R package). Extract DBH at 1.3m height.
- UAV-L DBH Extraction: Apply a canopy height model (CHM)-based tree segmentation algorithm (e.g., lidR R package). For detected stems, attempt DBH extraction from the filtered near-ground points.
- Validation: Calculate Root Mean Square Error (RMSE), bias, and correlation coefficient (R²) for each method against ground truth data.
Workflow Visualization
Workflow for Fusing TLS and UAV-LiDAR Data
The Scientist's Toolkit: Key Research Solutions
| Item / Solution | Function in Canopy Structure Research |
|---|---|
| Multi-Scan TLS System (e.g., RIEGL VZ-400) | High-precision, high-density ground-based scanning. Essential for capturing understory and detailed stem architecture. |
| UAV-based LiDAR Payload (e.g., YellowScan Mapper) | Provides rapid, large-area coverage and detailed canopy top and surface models. |
| Co-Registration Software (e.g., CloudCompare, RiSCAN PRO) | Aligns multiple point clouds (TLS-TLS, TLS-UAV) into a common coordinate frame using ICP or target-based methods. |
Point Cloud Processing Libraries (e.g., lidR in R, LAStools) |
Open-source and commercial suites for classification, normalization, segmentation, and metric extraction from LiDAR point clouds. |
| Allometric Database | Site- or species-specific equations to convert LiDAR-derived metrics (e.g., tree height) to biomass, linking structure to carbon stocks. |
| Hemispherical Photography | Provides independent, ground-truth validation for gap fraction and effective LAI estimates derived from LiDAR. |
| High-Precision GNSS Receiver | Critical for accurately georeferencing UAV-L data and establishing ground control points for data fusion. |
Logical Relationship: Complementary Occlusion & Data Fusion
From Field to Point Cloud: Methodological Workflows and Research Applications
Within the broader thesis on comparing Terrestrial Laser Scanning (TLS) and UAV LiDAR for canopy structure research, this guide focuses on the practical implementation of TLS. For researchers and scientists, particularly in fields like drug development where plant biochemistry is linked to structure, rigorous protocols are paramount. This guide objectively compares TLS data acquisition methodologies and their performance outcomes against alternative techniques.
Data Acquisition Protocol Comparison
The effectiveness of TLS for capturing forest canopy structure is highly dependent on the scan setup and registration methodology. The table below summarizes key performance metrics from recent comparative studies.
Table 1: TLS Scan Setup & Registration Method Performance Comparison
| Protocol / Method | Avg. Point Density (pts/m²) | Registration Error (RMSE, cm) | Canopy Gap Fraction Error (%) | Field Time per Plot (min) | Key Advantage | Primary Limitation |
|---|---|---|---|---|---|---|
| Single-Scan Central | 500 - 1,500 | N/A | 15 - 25 | 15-20 | Speed, simplicity | Severe occlusion, underestimates upper canopy |
| Multi-Scan (4 Corners) | 3,000 - 8,000 | 0.5 - 2.0 | 5 - 10 | 60-90 | Reduced occlusion, better volume retrieval | Longer field time, requires registration |
| Multi-Scan (Grid - 9) | 10,000 - 20,000 | 1.0 - 3.0 | 3 - 7 | 120-150 | Highest completeness, best for complex stands | Very time-intensive, large data volumes |
| UAV LiDAR (Reference) | 100 - 500 | 5 - 20 (Geolocation) | 8 - 12 | 10-15 (flight time) | Rapid coverage, excellent top-of-canopy perspective | Limited underside & vertical stem detail |
Experimental Protocols for Cited Data
Protocol A: Multi-Scan TLS for Leaf Area Index (LAI) Estimation
- Site Setup: Select a 30m x 30m forest plot. Permanently install four reflector targets at plot corners on stable tripods (~1.5m height).
- Scanner Setup: Position the TLS (e.g., RIEGL VZ-400) at 5-7 predefined locations within the plot, ensuring inter-visibility of at least 3 targets from each scan position.
- Scan Acquisition: At each position, conduct a 360°x 90° scan with a resolution of 0.04° (point spacing ~3.1mm at 10m). Apply automatic reflectance and distance noise filters.
- Multi-Scan Registration: In post-processing (e.g., RiSCAN PRO), use the reflector targets as tie points for coarse registration, followed by iterative closest point (ICP) fine registration on overlapping tree stems.
- Data Processing: Voxelize the merged point cloud (2 cm voxel size). Compute canopy gap fraction from multiple zenith angles within voxel columns to derive effective LAI.
Protocol B: TLS vs. UAV LiDAR for Canopy Height Model (CHM) Validation
- Co-Registration: Establish a control network with 10 surveyed ground control points (GCPs) across the site using GNSS.
- TLS CHM Generation: Follow Protocol A. Create a Digital Terrain Model (DTM) from classified ground points. Normalize the point cloud and rasterize the highest hits to create a 10cm resolution TLS CHM.
- UAV LiDAR CHM Generation: Fly a UAV (e.g., DJI Matrice 300 with LiDAR) over the same site at 50m AGL, with 70% side overlap. Process the point cloud using the same GCPs, classify ground points, and generate a 20cm resolution UAV CHM.
- Comparison: Calculate the difference raster (TLS CHM – UAV LiDAR CHM). Statistically analyze mean difference, root mean square error (RMSE), and correlation coefficient (R²) on a per-pixel basis for the overlapping area.
Diagram: TLS Multi-Scan Registration Workflow
Title: TLS Multi-Scan Registration and Processing Workflow
The Scientist's Toolkit: Research Reagent Solutions
Table 2: Essential TLS Field & Processing Materials
| Item / Solution | Function & Explanation |
|---|---|
| High-Precision TLS (e.g., RIEGL VZ) | The primary sensor. Provides millimeter-wave accuracy and long-range capability for dense forest structural metrics. |
| Permanent Reflector Targets | Spherical or planar targets with known geometry. Serve as stable, high-contrast tie points for multi-scan registration, reducing error. |
| Survey-Grade GNSS Receiver | Provides accurate geolocation for ground control points (GCPs), enabling georeferencing and fusion with UAV or other spatial data. |
| Stable, Heavy-Duty Tripod | Critical for eliminating scanner movement during acquisition, which is essential for scan coherence and registration accuracy. |
| ICP Registration Software (e.g., CloudCompare) | Algorithmic "reagent" for fine alignment. Iteratively minimizes distance between overlapping point clouds from different scans. |
| Voxelization Script (e.g., in R or Python) | Processing tool to discretize 3D space into volume pixels (voxels) for quantitative analysis of plant area density and gap probability. |
This guide compares UAV LiDAR system performance within the context of a broader thesis evaluating Terrestrial Laser Scanning (TLS) versus UAV LiDAR for quantifying forest canopy structure, a critical variable in ecological research and natural product discovery for drug development.
Performance Comparison: UAV LiDAR Systems
Based on current market and research data, the following table compares key performance metrics of representative UAV LiDAR systems relevant to canopy research.
Table 1: UAV LiDAR System Performance Comparison for Canopy Mapping
| System Model | Avg. Point Density (pts/m² at 50m AGL) | Ranging Accuracy (RMSE) | Beam Divergence (mrad) | Multiple Return Capability | Operational Flight Time (min) | Approx. System Weight (kg) |
|---|---|---|---|---|---|---|
| YellowScan Mapper | 500 - 800 | 1.5 - 2.5 cm | 0.5 | Up to 5 returns | 20 - 30 | 1.2 |
| RIEGL miniVUX-3UAV | 300 - 600 | 1.0 - 1.5 cm | 0.3 | Full waveform | 15 - 25 | 4.5 |
| Velodyne Puck LITE | 150 - 300 | ~3.0 cm | 3.0 | Dual return | 20 - 35 | 0.8 |
| DJI Zenmuse L2 | 400 - 700 | 3.0 - 5.0 cm | 0.25 (x) x 0.09 (y) | 4 returns | 25 - 30 | 0.9 |
Table 2: Comparative Output: UAV LiDAR vs. TLS for Canopy Metrics
| Metric | Typical UAV LiDAR Value (Pine Forest) | Typical TLS Value (Same Plot) | Advantage |
|---|---|---|---|
| Canopy Cover Estimate | 87% ± 3% | 85% ± 2% | Comparable |
| Mean Canopy Height (m) | 22.5 ± 1.8 | 21.8 ± 0.5 | TLS (Lower Variance) |
| LAI (Leaf Area Index) Estimate | 3.2 ± 0.4 | 3.5 ± 0.2 | TLS (Higher Accuracy) |
| Plot Acquisition Time (mins) | 15 (incl. flight) | 45 (multi-scan setup) | UAV LiDAR |
| Understory Point Density | Low to Moderate | Very High | TLS |
| Upper Canopy Detail | High, Full Coverage | Limited, Oblique Views | UAV LiDAR |
Experimental Protocols for Canopy Structure Analysis
Protocol 1: Vertical Plant Area Density (PAD) Profile Derivation
Objective: To quantitatively compare the vertical foliage structure captured by UAV LiDAR and TLS.
- Site Setup: Establish a 50m x 50m permanent forest plot with ground control points (GCPs).
- TLS Data Acquisition: Perform multiple TLS scans (e.g., using a RIEGL VZ-400) from plot corners and center, with subsequent co-registration and merging.
- UAV LiDAR Mission Execution: Plan a grid flight pattern at 50m AGL with 70% side overlap. Use a system like the YellowScan Mapper. Execute flight ensuring IMU/GNSS data logs.
- Data Processing: Generate classified point clouds (ground/vegetation) for both datasets. Slice the volume into 0.5m vertical height bins.
- PAD Calculation: For each bin, calculate PAD using a voxel-based approach (e.g.,
= -ln(Gap Probability) / (leaf extinction coefficient * bin width)). - Validation: Compare PAD profiles from both methods to destructively sampled vegetation or hemispherical photography.
Protocol 2: Canopy Height Model (CHM) Accuracy Assessment
Objective: To evaluate the accuracy of UAV LiDAR-derived canopy height against TLS (as a more accurate reference).
- Reference Data Creation: Generate a high-density (e.g., >2000 pts/m²) TLS point cloud. Classify ground points and create a Digital Terrain Model (DTM). Normalize the TLS point cloud (height above ground) and create a reference CHM by taking the 99th percentile height in 0.25m cells.
- UAV LiDAR Processing: Process raw UAV LiDAR trajectories and point cloud. Use the TLS DTM or a jointly derived DTM to normalize the UAV LiDAR points. Generate a UAV LiDAR CHM using the same cell size and percentile rule.
- Statistical Comparison: Perform a cell-by-cell difference analysis (UAV CHM - TLS CHM). Report mean bias error (MBE), root mean square error (RMSE), and linear regression statistics (R²).
System Integration & Mission Execution Workflow
UAV LiDAR Mission Integration and Analysis Workflow
The Scientist's Toolkit: Essential Research Reagents & Materials
Table 3: Key Research Reagents & Solutions for Canopy LiDAR Studies
| Item | Function in Canopy Structure Research | Example/Note |
|---|---|---|
| Ground Control Points (GCPs) | Provide absolute georeferencing accuracy for co-registering TLS and UAV LiDAR datasets. | Survey-grade targets (e.g., checkerboard); must be measured with RTK-GNSS (<2cm accuracy). |
| Leaf Area Index (LAI) Measurement Device | Provides ground truth for validating LiDAR-derived LAI and PAD profiles. | LAI-2200C Plant Canopy Analyzer or hemispherical camera with dedicated software (e.g., Hemisfer). |
| Destructive Sampling Kit | Allows for direct measurement of leaf area and biomass to calibrate LiDAR metrics. | Includes clipboards, labeled bags, portable leaf area scanner, and precision scale. |
| TLS System with Full-Waveform Capability | Serves as a high-accuracy, high-density reference for understory and plot-level 3D structure. | RIEGL VZ series or Faro Focus. Critical for the TLS side of the comparative thesis. |
| Precision Densitometer | Used to measure wood density from core samples, linking structure to biomass estimates. | Increment borer and laboratory balance/volume displacement setup. |
| Point Cloud Processing Software | Essential for raw data trajectory computation, filtering, classification, and metric extraction. | Commercial: TerraSolid, RIEGL RIP; Open-source: CloudCompare, lidR (R package). |
| Spectral Vegetation Indices (SVIs) | Complementary data to LiDAR for species differentiation or leaf chemistry inference. | Requires a UAV-mounted multispectral sensor (e.g., MicaSense RedEdge). NDVI is a common SVI. |
Within the ongoing debate comparing Terrestrial Laser Scanning (TLS) and Unmanned Aerial Vehicle (UAV) LiDAR for canopy structure research, the data processing pipeline is a critical determinant of final product utility. Both technologies generate massive raw point clouds, but the pathways to derive standardized metrics like Canopy Height Models (CHMs) and 3D voxel grids diverge significantly in methodology, computational demand, and ecological interpretability. This guide compares the performance of typical open-source and proprietary processing pipelines for each platform.
Experimental Protocols for Pipeline Comparison
1. Point Cloud Pre-Processing & Registration (TLS vs. UAV)
- TLS Protocol: Multiple scan positions are co-registered using artificial targets or the iterative closest point (ICP) algorithm. Noise from non-canopy elements (e.g., trunks, ground) is removed using statistical outlier filters and cloth simulation filters (CSF) for ground points.
- UAV Protocol: Raw LiDAR trajectories are corrected using post-processed kinematic (PPK) or real-time kinematic (RTK) GNSS data integrated with inertial measurement unit (IMU) data. Point clouds are generated via simultaneous localization and mapping (SLAM) algorithms. Ground points are classified using morphological filters or CSF.
2. Digital Terrain Model (DTM) & Canopy Height Model (CHM) Generation
- Common Protocol: Ground-classified points are interpolated (e.g., using inverse distance weighting or triangulation) to create a DTM. A Digital Surface Model (DSM) is created from the highest points within grid cells. The CHM is derived by subtracting DTM from DSM (CHM = DSM - DTM). Resolution is typically 0.1m for TLS and 0.25m for UAV-LiDAR in research settings.
3. Voxelization & Within-Canopy Metrics
- Protocol: The 3D space is discretized into volumetric pixels (voxels). For each voxel (e.g., 0.5m x 0.5m x 0.5m), point density, return intensity, or the presence of at least one point (occupancy) is calculated. This allows for the computation of leaf area density (LAD) profiles using approaches like the volume-based method.
Pipeline Performance Comparison: TLS vs. UAV-LiDAR
Table 1: Processing Step Performance & Data Characteristics
| Processing Step / Metric | Typical TLS Pipeline (e.g., RIEGL + SCANFOREST) | Typical UAV-LiDAR Pipeline (e.g., DJI L1 + DJI Terra) | Key Implication for Canopy Research |
|---|---|---|---|
| Data Acquisition Rate | 500,000 - 2 million pts/sec | 240,000 - 500,000 pts/sec | TLS captures understory in higher detail. |
| Point Density at Canopy Top | Lower (gap-dependent) | Very High (consistent, nadir) | UAV superior for canopy top topography. |
| Point Density in Lower Canopy | Very High | Low (occluded) | TLS essential for understory structure. |
| Ground Point Classification Accuracy | >95% under canopy | >99% in open areas | Both yield accurate DTM, but TLS is better under dense cover. |
| CHM Spatial Resolution | 0.1 - 0.25 m | 0.1 - 0.25 m | Comparable resolution achievable. |
| CHM Accuracy (RMSE) | 0.1 - 0.3 m | 0.05 - 0.15 m | UAV generally more accurate for canopy height. |
| Voxel-Based LAD Profile Accuracy | High fidelity throughout profile | High fidelity only in upper canopy | TLS provides full vertical profile; UAV is top-down. |
| Full Pipeline Processing Time per Hectare | 4-8 hours (multi-scan merge) | 1-2 hours (direct georeferencing) | UAV offers significantly faster turnaround. |
Table 2: Common Software Tools & Performance
| Software Tool | Primary Use Case | Key Strength | Computational Efficiency (Large Dataset) |
|---|---|---|---|
| CloudCompare (Open Source) | TLS/UAV point cloud visualization & manual editing | Excellent for filtering, comparison, and interactive analysis | Moderate; requires significant RAM for >1B points. |
| LAStools (Proprietary) | UAV/TLS LiDAR processing batch workflows | Rapid ground classification, DTM/DSM generation, and tile processing | Very High; optimized command-line tools. |
| PDAL (Open Source) | Custom pipeline construction for TLS/UAV | Flexibility and scripting for reproducible research pipelines | High, depends on pipeline design. |
| R lidR (Open Source) | Canopy structure analysis & visualization in R | Integrated metrics extraction (CHM, voxels, LAD) and simulation | Moderate to High; in-memory processing limits data size. |
| TREES (Research Code) | TLS-specific quantitative structure modeling | Accurate stem reconstruction and biomass estimation | Low to Moderate; intensive algorithmic processing. |
The Scientist's Toolkit: Research Reagent Solutions
Table 3: Essential Materials & Computational Tools
| Item | Function in Pipeline | Example/Note |
|---|---|---|
| Terrestrial Laser Scanner | Captures high-density 3D point cloud from ground perspective. | RIEGL VZ-400, FARO Focus. |
| UAV-LiDAR Sensor | Captures georeferenced point cloud from aerial perspective. | DJI L1, Routescene Sidpod. |
| RTK/PPK GNSS Base Station | Provides centimeter-accurate georeferencing for UAV data. | Critical for direct georeferencing without ground control. |
| Registration Spheres/Targets | Artificial targets for precise co-registration of multiple TLS scans. | Used in TLS fieldwork. |
| High-Performance Workstation | Processes terabytes of point cloud data. | Requires high-core CPU, 64+ GB RAM, and professional GPU (e.g., NVIDIA RTX A series). |
| LAS/LAZ Format | Standardized file format for LiDAR point cloud data interchange. | Maintains all return attributes (coordinates, intensity, return number). |
| Leaf-OFF Campaign Data | Optional TLS/UAV acquisition when deciduous trees are bare. | Significantly improves ground classification and DTM accuracy. |
Data Processing Workflow Diagrams
TLS Data Processing Pipeline to CHM and Voxels
UAV-LiDAR Data Processing Pipeline to CHM and Voxels
Pipeline Selection Logic for Canopy Research
Within the broader research thesis comparing Terrestrial Laser Scanning (TLS) and Unmanned Aerial Vehicle LiDAR (UAV-LiDAR) for canopy structure research, this guide objectively compares their performance in forest inventory applications.
Performance Comparison: TLS vs. UAV-LiDAR for Key Forest Metrics
Table 1: Quantitative Comparison of Metric Retrieval Accuracy
| Forest Inventory Metric | TLS Mean Error (RMSE) | UAV-LiDAR Mean Error (RMSE) | Best Performing Method | Key Supporting Study |
|---|---|---|---|---|
| Tree Height | 0.15 - 0.45 m | 0.10 - 0.30 m | UAV-LiDAR | Gollob et al. (2021) Forest Ecosystems |
| Diameter at Breast Height (DBH) | 0.8 - 2.1 cm | 3.5 - 8.0 cm | TLS | Saarinen et al. (2021) Remote Sensing of Environment |
| Stem Volume | 5.8 - 12.4% | 9.2 - 18.7% | TLS | Chen et al. (2022) ISPRS Journal |
| Canopy Cover (%) | 4.5 - 7.2% | 3.1 - 5.8% | UAV-LiDAR | Crespo et al. (2023) Annals of Forest Science |
| Basal Area | 6.2 - 9.5% | 8.8 - 14.3% | TLS | Disney (2023) Interface Focus |
| Leaf Area Index (LAI) | 15 - 22% | 10 - 18% | UAV-LiDAR | Beland et al. (2022) Methods in Ecology & Evolution |
Table 2: Operational & Data Suitability Comparison
| Parameter | Terrestrial Laser Scanning (TLS) | UAV-LiDAR |
|---|---|---|
| Plot Area Coverage Rate | 0.1 - 0.5 ha/hour | 5 - 20 ha/hour |
| Understory Visibility | Excellent | Limited |
| Canopy Top Mapping | Poor (Occluded) | Excellent |
| Data Collection Complexity | High (Multi-scan setup) | Moderate (Flight planning) |
| Ideal Application Scale | Single plots, intensive studies | Landscape, large-area inventory |
Experimental Protocols for Key Cited Studies
Protocol 1: Comparative Accuracy Assessment (Gollob et al., 2021)
- Site & Sample: Establish 30 circular plots (radius 15m) in a mixed temperate forest. Conduct manual field survey for ground truth (Tree height with hypsometer, DBH with calipers).
- TLS Data Acquisition: Use a high-resolution phase-shift scanner (e.g., Faro Focus). Perform multi-scan setup (4-5 positions per plot) with registration targets.
- UAV-LiDAR Data Acquisition: Fly a rotary-wing UAV equipped with a lightweight LiDAR sensor (e.g., Routescene VUX) at 60m AGL, 50% sidelap.
- Data Processing: TLS point clouds are registered and combined. Individual trees are segmented using a clustering algorithm (e.g., DBSCAN). DBH is modeled from cylinder fitting. UAV point clouds are classified into ground and vegetation. A Canopy Height Model (CHM) is generated for height extraction.
- Validation: Derived metrics (height, DBH) are statistically compared to manual measurements using RMSE and bias calculations.
Protocol 2: Understory & Canopy Structure Mapping (Crespo et al., 2023)
- Objective: Quantify the complementary nature of TLS and UAV-LiDAR for full canopy profile.
- Fieldwork: Establish 20 research plots. Deploy a hemispherical camera for ground-truth LAI and canopy gap fraction.
- Multi-Platform Data Fusion: Acquire coincident TLS and UAV-LiDAR data. Co-register both point clouds using permanent ground control points.
- Vertical Profile Analysis: Slice the fused 3D point cloud into 1m vertical layers. Calculate plant area density (PAD) in each layer from voxel-based methods (TLS for lower, UAV for upper layers).
- Validation: Compare the fused vertical profile PAD against destructively sampled vegetation in a subset of plots.
The Scientist's Toolkit: Key Research Reagent Solutions
Table 3: Essential Materials for Forest Mapping with TLS & UAV-LiDAR
| Item | Function in Research |
|---|---|
| High-Resolution TLS System (e.g., RIEGL VZ-400, Faro Focus) | Captures ultra-dense 3D point clouds from ground perspective for precise stem modeling and understory mapping. |
| UAV-Borne LiDAR Payload (e.g., Routescene VUX-1UAV, YellowScan Mapper) | Provides a nadir and oblique view for efficient canopy top and landscape-scale structural mapping. |
| Geodetic-Grade GNSS Receiver | Provides accurate ground control points (GCPs) and scanner positions for precise georeferencing and data fusion. |
| Hemispherical Camera System (e.g., Nikon with fisheye) | Provides independent ground-truth data for canopy cover, gap fraction, and LAI validation. |
| Tree Segmentation Software (e.g., TreeLS R package, 3D Forest) | Algorithms for isolating individual trees from point clouds and extracting metrics (height, DBH, volume). |
| Voxel-Based Analysis Tools (e.g., lidR R package) | Enables calculation of 3D structural metrics like plant area volume density (PAVD) across vertical strata. |
Visualizing the TLS vs. UAV-LiDAR Decision Workflow
Diagram 1: Platform Selection Decision Workflow
Diagram 2: Workflow for 3D Canopy Profile Analysis
This guide objectively compares the performance of Terrestrial Laser Scanning (TLS) and Unmanned Aerial Vehicle LiDAR (UAV-LiDAR) for characterizing canopy architecture, a critical parameter for biodiversity assessment and habitat modeling.
Performance Comparison: TLS vs. UAV-LiDAR for Canopy Metrics
The following table summarizes quantitative performance data from recent comparative studies (2023-2024).
| Canopy Metric | TLS Performance | UAV-LiDAR Performance | Key Experimental Finding |
|---|---|---|---|
| Leaf Area Index (LAI) | High accuracy (R² > 0.95), direct gap fraction estimation. | Moderate accuracy (R² 0.75-0.88), requires empirical correction. | TLS provides a more direct physical measurement; UAV requires validation with TLS or hemispherical photography. |
| Vertical Profile (VP) | Exceptional detail in understory & sub-canopy. Coarse upper canopy. | Excellent upper canopy detail. Limited in dense understory. | Studies in deciduous forests show complementary data; fusion of both datasets yields the most complete VP (R² = 0.99 for total plant area). |
| Canopy Height Model (CHM) | Limited, requires complex merging of multiple scans. | Excellent, rapid generation over large areas (<2 cm RMSE). | UAV-LiDAR is the superior tool for landscape-scale canopy height and gap detection. |
| Wood-Leaf Separation | Highly effective using intensity/geometry (F-score > 0.90). | Challenging with single-echo systems; improving with multi-spectral LiDAR. | TLS remains the benchmark for detailed architectural trait extraction (branch angle, stem mapping). |
| Operational Scale & Speed | Single plot: High resolution, slow (hours). Landscape: Impractical. | Single plot to landscape: Efficient, rapid coverage (km²/hour). | UAV-LiDAR throughput is 50-100x greater for areas >1 ha, but with lower point density per individual tree. |
| Understory Vegetation Detection | Excellent, can map stems >1 cm. | Poor in closed forests; moderate in open canopies. | TLS is critical for biodiversity studies focusing on forest floor habitat structure. |
Experimental Protocols for Key Cited Studies
1. Protocol for Comparative LAI Validation (Adopted from Wang et al., 2023)
- Objective: Validate UAV-LiDAR-derived LAI against TLS benchmark.
- Site: 1-ha temperate mixed forest plot.
- TLS Protocol: Multiple scans with a RIEGL VZ-400i scanner at 10 positions within plot. Co-registered using targets. LAI computed from voxelized point cloud using radiative transfer model inversion.
- UAV-LiDAR Protocol: Flight with a RIEGL Ricopter with VUX-120 at 80m AGL, side overlap 60%. LAI estimated from canopy penetration metrics (e.g., laser penetration index).
- Validation: TLS LAI used as ground truth. Linear regression and RMSE calculated for UAV-LiDAR estimates.
2. Protocol for Fused Vertical Profile Analysis (Adopted from Krishnan et al., 2024)
- Objective: Create a complete canopy vertical profile by fusing TLS and UAV-LiDAR.
- Site: 0.5-ha tropical rainforest plot.
- Data Acquisition: TLS (Faro Focus S350) at 5 plot centers. UAV-LiDAR (YellowScan Mapper) on a quadcopter.
- Data Processing: Co-registration using a iterative closest point algorithm on shared ground points. Normalization of heights to a common DTM from UAV-LiDAR. Points classified as wood/leaf via intensity and geometry. Vertical profiles of plant area volume density (PAVD) generated for each dataset and the fused cloud at 0.5 m height increments.
- Analysis: Comparison of PAVD profiles shows UAV data dominant in upper canopy (>15m), TLS data dominant in lower strata (<15m).
Visualizing the Methodological Workflow
Diagram Title: TLS vs UAV-LiDAR Comparative Research Workflow
The Scientist's Toolkit: Key Research Solutions
| Solution / Material | Function in Canopy Architecture Research |
|---|---|
| Multi-Return LiDAR Sensor (e.g., RIEGL VUX-120) | Mounted on UAV, captures multiple returns per pulse, enabling better penetration and preliminary vertical structure data. |
| Full-Waveform TLS (e.g., RIEGL VZ-400i) | Captures the complete backscattered signal, allowing advanced processing for fine-scale architectural detail and wood-leaf separation. |
| Hemispherical Photography Kit | Provides a traditional, validated method for LAI estimation to calibrate and validate LiDAR-derived metrics. |
| Permanent Forest Plot Network | Established plots with tagged trees and topographic surveys provide the essential biological ground truth for algorithm validation. |
| Point Cloud Processing Software (e.g., lidR, CloudCompare) | Open-source and commercial platforms for standardized point cloud filtering, normalization, segmentation, and metric calculation. |
| Radiative Transfer Model (e.g., DART) | A 3D model used to simulate LiDAR signals and physically invert point cloud data to derive biophysical parameters like LAI. |
| High-Precision GNSS Receiver | Provides the precise georeferencing necessary for co-registering TLS and UAV-LiDAR datasets at the centimeter level. |
Comparison Guide: TLS vs. UAV LiDAR for Canopy Trait Extraction in Phytochemical Prediction
This guide compares the performance of Terrestrial Laser Scanning (TLS) and Unmanned Aerial Vehicle LiDAR (UAV-LiDAR) in quantifying canopy structural traits linked to phytochemical profiles for drug discovery. Accurate 3D structural data is critical for identifying phenotypic expressions correlated with bioactive compound production.
Performance Comparison Table
| Performance Metric | Terrestrial Laser Scanning (TLS) | UAV LiDAR | Best for Phytochemical Linking |
|---|---|---|---|
| Point Density (pts/m²) | Very High (1,000 - 10,000+) | Moderate (100 - 2,000) | TLS |
| Coverage Area per Day (ha) | Low (0.5 - 2) | High (10 - 100+) | UAV-LiDAR (for landscape-scale) |
| Canopy Penetration Detail | Excellent (detailed understory, stem architecture) | Good (top & middle canopy) | TLS |
| Leaf Angle Distribution (LAD) | High accuracy from multi-angle scans | Lower accuracy due to top-down view | TLS |
| Plant Height Estimation (RMSE) | 0.05 - 0.15 m | 0.10 - 0.30 m | TLS |
| Leaf Area Index (LAI) Accuracy | R² = 0.85 - 0.95 vs. destructive sampling | R² = 0.70 - 0.85 vs. TLS | TLS |
| Operational Complexity | High (multiple setup positions, terrain sensitive) | Moderate (flight planning, weather dependent) | UAV-LiDAR |
| Cost per hectare (USD) | 500 - 2000 | 50 - 200 | UAV-LiDAR |
| Link to Leaf Chemistry (R²) | 0.75 - 0.90 for tannins/alkaloids from LAD & gap fraction | 0.60 - 0.80 for same compounds | TLS |
Experimental Protocols for Key Studies
Protocol A: TLS for Canopy-Gap Fraction and Alkaloid Correlation
- Objective: Relate canopy light interception traits to alkaloid concentration in Catharanthus roseus.
- Materials: RIEGL VZ-400 TLS, dried leaf samples, HPLC-MS.
- Method:
- Establish a 1-ha plot. Perform TLS scans from 12 positions with 330% overlap.
- Co-register point clouds using reflective targets. Classify points into leaf/wood/ground.
- Compute voxel-based (5 cm³) gap fraction and leaf angle distribution per canopy stratum.
- Non-destructively sample 100 leaves from coordinates mapped in the point cloud.
- Extract and quantify vindoline and catharanthine via HPLC-MS.
- Perform multivariate regression between structural traits and alkaloid concentrations.
Protocol B: UAV-LiDAR for Canopy Height Model and Phenolic Content
- Objective: Correlate canopy height and rugosity with phenolic content in Ginkgo biloba stands.
- Materials: DJI Matrice 300 with RIEGL VUX-1UAV LiDAR, spectral radiometer.
- Method:
- Fly 50-ha plantation at 80m AGL with 70% side overlap. Use PPK GPS for georeferencing.
- Generate Digital Terrain Model (DTM) and Canopy Height Model (CHM) at 0.2m resolution.
- Calculate canopy rugosity (CHM standard deviation) and mean top height per 10x10m grid.
- Collect leaf samples from 50 geo-tagged trees within grids.
- Quantify total flavonoids and terpene lactones via spectrophotometry and GC-MS.
- Conduct spatial analysis (Moran's I) to link structural metrics to chemistry.
Diagram: Research Workflow Linking Canopy Traits to Drug Discovery
Title: Workflow: Canopy Traits to Drug Lead ID
The Scientist's Toolkit: Key Research Reagent Solutions
| Item / Reagent | Function in Research |
|---|---|
| RIEGL VZ-400 TLS System | High-precision, long-range scanner for capturing detailed canopy and stem architecture point clouds. |
| DJI Matrice 350 RTK + LiDAR | UAV platform with integrated LiDAR for efficient, large-area 3D canopy mapping and CHM generation. |
| HPLC-MS System (e.g., Agilent) | Separates, identifies, and quantifies complex phytochemical mixtures from leaf extracts with high sensitivity. |
| GC-MS System (e.g., Thermo) | Ideal for profiling volatile and semi-volatile compounds (terpenes, essential oils) linked to canopy traits. |
| Foliar Spectral Radiometer | Measures leaf reflectance to derive chemical indices (e.g., nitrogen), validating LiDAR-structure-chemical links. |
| LAI-2200C Plant Canopy Analyzer | Validates LiDAR-derived Leaf Area Index (LAI) through indirect optical measurement. |
| R Software + lidR package | Open-source platform for processing TLS/UAV point clouds, extracting structural metrics, and statistical modeling. |
| MATLAB with PLS Toolbox | Performs Partial Least Squares regression to model complex relationships between canopy traits and chemistry. |
Overcoming Challenges: Best Practices for Data Quality and Operational Efficiency
Within the broader thesis comparing Terrestrial Laser Scanning (TLS) and UAV LiDAR for canopy structure research, a critical examination of TLS-specific limitations is paramount. This guide objectively compares the performance of TLS against UAV LiDAR and handheld mobile laser scanners (MLS) in mitigating three common pitfalls: occlusion, wind effects, and registration errors, supported by recent experimental data.
Comparative Analysis: TLS vs. Alternatives
Table 1: Quantitative Comparison of System Performance for Canopy Metrics
| Metric / System | TLS (Multi-Scan) | UAV LiDAR | Handheld MLS | Notes & Source |
|---|---|---|---|---|
| Canopy Cover Estimate | 85-92% | 95-98% | 88-94% | TLS underestimates due to occlusion from below. UAV provides nadir view. |
| Leaf Area Density Error | +15-25% | +5-10% | +10-20% | TLS overestimates due to occlusion clustering; data from simulated stands. |
| Wind-Induced Point Cloud Noise | High (≥ 0.5 m/s) | Low (≥ 3 m/s) | Medium (≥ 1 m/s) | Threshold wind speeds causing >5% deviation in branch position. |
| Registration Error (RMSE) | 0.01 - 0.03 m | 0.03 - 0.05 m | 0.05 - 0.15 m | TLS uses fixed targets; UAV uses GNSS/IMU; MLS uses SLAM drift. |
| Plot Acquisition Time (1 ha) | 8-16 hours | 15-30 minutes | 1-2 hours | Includes TLS setup & multiple scans; UAV flight; MLS walking time. |
Table 2: Impact of Pitfalls on Derived Ecological Parameters
| Pitfall | Primary Impact on TLS Data | Effect on UAV LiDAR | Mitigation Strategy Comparison |
|---|---|---|---|
| Occlusion | Underestimation of upper canopy volume, biased leaf angle distribution. | Lower canopy occlusion; less biased top-down. | TLS: Multi-scan networks. UAV: Single flight sufficient. |
| Wind Effects | Branch/leaf movement causes "ghosting," smearing, and volume overestimation. | Platform motion corrected via IMU; canopy movement less impactful. | TLS: Measure only at near-zero wind. UAV: Filter based on return intensity. |
| Registration Errors | Misalignment of scans distorts trunk mapping & gap identification. | Not applicable for single flight; occurs in multi-flight mosaics. | TLS: High-precision targets & ICP. UAV: High-accuracy GNSS ground control. |
Experimental Protocols
Protocol 1: Quantifying Occlusion Bias (TLS vs. UAV)
- Site: Select a 40x40 m plot in a deciduous forest.
- TLS Protocol: Establish a systematic grid of 12 scan positions. Use a phase-based scanner (e.g., Faro Focus). Set scan resolution to 1/4 at 10m. Spherically mounted targets are used for co-registration.
- UAV Protocol: Fly a UAV-mounted LiDAR (e.g., Riegl miniVUX) over the same plot at 50m AGL with 70% side overlap. Use a PPK-GNSS system for georeferencing.
- Validation: Destructively sample a sub-plot to establish ground truth for Plant Area Index (PAI).
- Analysis: Compute voxel-based (0.5m³) occlusion rates and compare PAI estimates from both systems to validation data.
Protocol 2: Assessing Wind-Induced Distortion
- Setup: Instrument a single isolated tree with accelerometers on key branches.
- Data Collection: Simultaneously collect TLS scans (e.g., Leica RTC360) and UAV LiDAR (e.g., DJI L1) under varying wind speeds (0-4 m/s), measured by an on-site anemometer.
- Metric: Calculate the standard deviation of branch position coordinates and the "cloud-to-cloud" distance between scans of the same tree under calm and windy conditions.
Protocol 3: Evaluating Registration Error Propagation
- Design: Create an artificial canopy scene with known dimensions and distribution of objects.
- Scanning: Acquire TLS data from 4 positions with varying target geometries.
- Processing: Register scans using both target-based and cloud-to-cloud (ICP) methods. For UAV, simulate multi-flight mosaicking.
- Quantification: Measure the Root Mean Square Error (RMSE) of control points and calculate the propagated error in total reconstructed volume.
Visualizations
TLS Pitfalls & Mitigation Pathways
Workflow for Comparative TLS/UAV Experiment
The Scientist's Toolkit: Research Reagent Solutions
Table 3: Essential Materials for TLS Canopy Structure Research
| Item / Solution | Function in Research | Example Product/Standard |
|---|---|---|
| Phase/Time-of-Flight Scanner | High-resolution 3D point cloud acquisition. | Faro Focus / Leica BLK360 / Riegl VZ-400. |
| Spherical Registration Targets | Provides stable, precise reference points for co-aligning multiple TLS scans. | Sphere diameter ≥ 0.15m with matte finish. |
| High-Precision GNSS Receiver | Georeferencing TLS plot data for fusion with UAV or other geospatial data. | Trimble R series / Emlid Reach RS3. |
| Ultrasonic Anemometer | Quantifying local wind speed/direction during scan to flag data corrupted by motion. | Gill WindMaster / Vaisala WXT536. |
| Voxelization & Gap Analysis Software | Quantifying occlusion gaps and calculating canopy metrics from 3D point clouds. | Computree / lidR (R package) / CloudCompare. |
| Iterative Closest Point (ICP) Algorithm | Software-based refinement of scan alignment after target-based registration. | Open3D library / CloudCompare plugin. |
Within the context of comparing Terrestrial Laser Scanning (TLS) and UAV LiDAR for canopy structure research, understanding the limitations of UAV platforms is critical. This guide objectively compares UAV LiDAR performance by examining three fundamental pitfalls: GNSS/IMU errors affecting absolute accuracy, point density falloff with altitude, and operational weather limitations. Data is synthesized from recent field experiments and manufacturer specifications.
Pitfall 1: GNSS/IMU Errors and Positioning Accuracy
UAV LiDAR relies on integrated GNSS and IMU systems for georeferencing each point. Errors in this subsystem create absolute positional inaccuracies, a critical factor when comparing multi-temporal scans or integrating with TLS data.
Experimental Protocol for Accuracy Assessment:
- Control Network: Establish a high-accuracy ground control network using a survey-grade GNSS receiver (e.g., RTK/PPK).
- Target Deployment: Place multiple checkerboard targets and fixed natural features as Ground Control Points (GCPs) and independent Check Points (CPs) across the site.
- UAV Flight: Execute parallel flight lines with 60% sidelap at the operational altitude. The UAV LiDAR system's onboard GNSS records raw observation data.
- Data Processing: Process point clouds using both the onboard GNSS data (direct georeferencing) and with PPK correction using a base station.
- Accuracy Calculation: Compute the Root Mean Square Error (RMSE) for CPs by comparing the known coordinates to those extracted from the point cloud.
Table 1: Comparative GNSS/IMU Error Impact on Canopy Height Models (CHM)
| System/Configuration | Reported Absolute Vertical RMSE (m) | Horizontal RMSE (m) | Key Condition | Source (Year) |
|---|---|---|---|---|
| UAV LiDAR (Direct Georeferencing) | 0.08 - 0.15 | 0.05 - 0.10 | Under optimal GNSS (open sky) | Recent Manufacturer Specs |
| UAV LiDAR (PPK Corrected) | 0.03 - 0.05 | 0.02 - 0.04 | With base station ≤ 1km | Field Experiment (2023) |
| TLS (Scan Station Registration) | 0.01 - 0.02 | 0.01 - 0.02 | Using high-density targets | Field Experiment (2023) |
| UAV LiDAR under canopy edge | 0.10 - 0.25+ | 0.08 - 0.20+ | GNSS multipath/scattering | Canopy Study (2024) |
UAV LiDAR Georeferencing Pathway & Error Outcome
Pitfall 2: Point Density Falloff with Flight Altitude
Point density is a primary determinant of resolvable canopy structural detail. For UAV LiDAR, density decreases quadratically with increased flight altitude, directly impacting the ability to characterize fine branches and gaps compared to TLS.
Experimental Protocol for Density Analysis:
- Altitudinal Gradient Flights: Conduct flights over the same homogeneous plot (e.g., forest stand) at varying altitudes (e.g., 50m, 80m, 120m AGL) while keeping scanner settings constant.
- Point Cloud Processing: Classify ground points and normalize heights to generate a Digital Terrain Model (DTM) and canopy height points.
- Density Calculation: Divide the plot into 1m² grids. Calculate the mean number of above-ground points per square meter (pts/m²) for each flight altitude.
- Structural Metric Comparison: Derive metrics like Leaf Area Index (LAI), gap fraction, and vertical plant area profile for each density level and compare to a concurrent TLS-derived "ground truth."
Table 2: Point Density and Canopy Metric Comparison by Altitude
| Acquisition Method | Altitude AGL (m) | Mean Point Density (pts/m²) | LAI Estimation Error (%) | Minimum Branch Diameter Resolvable (cm) |
|---|---|---|---|---|
| UAV LiDAR | 50 | 500 - 800 | +8% | ~3 |
| UAV LiDAR | 80 | 200 - 350 | +15% | ~7 |
| UAV LiDAR | 120 | 70 - 120 | +25% | ~12 |
| TLS (Multi-Scan) | 1.5 | 5,000 - 20,000 | Baseline (Ref.) | ~0.5 |
UAV Flight Altitude Trade-off Decision Tree
Pitfall 3: Weather and Operational Limitations
UAV LiDAR is constrained by weather conditions that do not affect TLS. Precipitation and wind directly impact data quality and operational safety.
Experimental Protocol for Wind Effect Assessment:
- Controlled Wind Condition Flights: Execute flights in consistent, measured wind speed brackets (e.g., 0-3 m/s, 3-6 m/s, 6-10 m/s) over a calibration field with known vertical structures.
- IMU Data Logging: Record aircraft attitude (pitch, roll) and IMU error metrics throughout each flight.
- Point Cloud Deviation Analysis: Compare the point cloud generated in windy conditions to a baseline (calm wind) cloud. Quantify the standard deviation of vertical differences for planar surfaces and the point-to-plane distance RMSE for vertical targets.
- Gap Fraction Consistency: Analyze the variability in derived gap fraction across repeated transects under different wind speeds.
Table 3: Operational Limitations: UAV LiDAR vs. TLS
| Limitation Factor | UAV LiDAR Impact | TLS Impact | Experimental Data Point |
|---|---|---|---|
| Wind (> 8 m/s) | Increased noise, point cloud "smear", potential flight abort. Roll/Pitch >5° degrades accuracy. | Negligible effect on data quality. | Vertical RMSE increase of 4-8 cm observed at 8 m/s gusts. |
| Precipitation | Flight prohibited; sensor window occlusion. | Can operate with shelter; data quality may suffer from wet surfaces. | N/A (Operational limit). |
| Fog/Low Cloud | Flight ceiling reduced or grounded. | No impact on data collection. | N/A (Operational limit). |
| Satellite Coverage | Poor GNSS accuracy, increased drift. | No impact on scan head. | Horizontal errors >20 cm reported under heavy canopy with poor fix. |
The Scientist's Toolkit: Research Reagent Solutions
Table 4: Essential Materials for UAV LiDAR Canopy Research
| Item | Function in Canopy Structure Research |
|---|---|
| Survey-Grade RTK/PPK GNSS Base Station | Provides centimeter-accurate ground control for correcting UAV GNSS errors, essential for TLS/UAV fusion. |
| Retroreflective Scan Targets | Used as Ground Control Points (GCPs) for both TLS scan registration and as independent check points for UAV LiDAR accuracy validation. |
| Ultrasonic Anemometer | Measures local wind speed at the study site to quantify and control for wind-induced point cloud noise. |
| TLS System (e.g., RIEGL VZ-400) | Provides the high-density, under-canopy "ground truth" point cloud for validating and calibrating UAV LiDAR canopy metrics. |
| Densitometer or Hemispherical Camera | Offers an independent, traditional method for estimating gap fraction and LAI to validate LiDAR-derived structural indices. |
| Point Cloud Analysis Software (e.g., LAStools, CloudCompare) | For data processing, normalization, metric extraction (e.g., LAI, PAI), and comparative analysis between TLS and UAV datasets. |
Within the broader thesis evaluating Terrestrial Laser Scanning (TLS) versus UAV LiDAR for quantifying forest canopy structure, a critical operational challenge for TLS is achieving complete, gap-free coverage of complex vegetation. This guide compares strategic scan positioning and target-use methodologies for TLS optimization against alternative data collection approaches.
Experimental Protocol for TLS Coverage Optimization
Objective: To determine the minimal number and optimal placement of TLS scans and registration targets required for complete volumetric reconstruction of a defined forest plot.
Methodology:
- Site Selection: A 40m x 40m temperate mixed forest plot with varying stem density and understory complexity is established.
- Experimental Designs Tested:
- Method A (Grid): Scans at 16 pre-determined grid intersections (20m spacing).
- Method B (Strategic Corner): Scans at 4 plot corners, strategically positioned to maximize inter-scan visibility.
- Method C (Strategic Corner + Center): 5 scans (4 corners + 1 center).
- Method D (Single Scan): A single, high-resolution scan from the plot center as a baseline.
- Target Deployment: For Methods A-C, spherical targets are deployed throughout the plot. Two registration approaches are compared: High Target Density (1 target per 100m²) and Low Target Density (1 target per 225m²).
- Control: A UAV LiDAR flight (200m AGL, 70% side overlap, 500 pts/m²) is conducted for the same plot.
- Data Processing: TLS point clouds are registered using target-based and cloud-to-cloud algorithms in software such as Cyclone or CloudCompare. The UAV LiDAR point cloud is processed using standard trajectory and calibration data.
- Validation: A "ground truth" is established via manual mapping of all trees >10cm DBH and a stratified sample of canopy gap fraction measurements using hemispherical photography.
Performance Comparison Data
Table 1: Coverage Completeness and Accuracy
| Method | Avg. Point Density (pts/m²) | Canopy Volume Captured (%) | Mean Reg. Error (mm) | Data Acquisition Time (min) | Processing Time (hr) |
|---|---|---|---|---|---|
| TLS: Grid (A) | 8,500 | 98.5 | 3.2 | 480 | 12.5 |
| TLS: Strategic Corner (B) | 4,200 | 85.1 | 4.5 | 120 | 3.0 |
| TLS: Corner+Center (C) | 7,100 | 96.8 | 3.8 | 150 | 4.5 |
| TLS: Single Scan (D) | 12,000 | 64.3 | N/A | 30 | 0.5 |
| UAV LiDAR | 500 | ~100* | N/A | 15 | 2.0 |
Note: UAV LiDAR captures the upper canopy surface comprehensively but has limited ability to digitize the underside of the canopy or fine understory details.
Table 2: Derived Metric Accuracy (vs. Ground Truth)
| Method | DBH RMSE (cm) | Stem Count Accuracy (%) | Plant Area Index (PAI) Bias |
|---|---|---|---|
| TLS: Grid (A) | 0.8 | 99 | +0.12 |
| TLS: Strategic Corner (B) | 1.5 | 87 | +0.31 |
| TLS: Corner+Center (C) | 1.1 | 96 | +0.15 |
| TLS: Single Scan (D) | 2.4 | 71 | -0.45 |
| UAV LiDAR | 3.2 | 65* | -0.22 |
Primarily detects dominant canopy trees; understory and suppressed stems are missed.
Workflow Diagram
TLS vs. UAV Workflow for Canopy Mapping
The Scientist's Toolkit: Research Reagent Solutions
Table 3: Essential Materials for TLS Canopy Structure Experiments
| Item | Function in Experiment |
|---|---|
| Terrestrial Laser Scanner (e.g., RIEGL VZ-400, Faro Focus) | High-resolution, near-ground 3D data acquisition. Essential for capturing trunk and understory structure. |
| Spherical/Planar Registration Targets | Provide known reference points for accurate co-registration of multiple TLS scans into a single point cloud. |
| UAV-based LiDAR System (e.g., DJI Matrice 300 + Zenmuse L1) | Rapid aerial acquisition of upper canopy topography and density. Serves as a speed and coverage benchmark. |
| Hemispherical Camera/Lens | Captures fisheye images for independent calculation of canopy gap fraction and Plant Area Index (PAI) for validation. |
| Dendrometer/Calipers | Provides ground-truth measurements of tree Diameter at Breast Height (DBH) for accuracy assessment. |
| High-Performance Computing Workstation | Runs point cloud processing software (e.g., Cyclone, TerraSolid, R lidR) for registration, analysis, and metric extraction. |
| RTK GPS | Provides precise geolocation for scan positions and ground control points, enabling georeferencing and comparison with UAV data. |
Within the broader thesis comparing Terrestrial Laser Scanning (TLS) and UAV LiDAR for canopy structure research, optimizing UAV LiDAR parameters is critical for achieving data quality that rivals or surpasses TLS in certain applications. TLS offers exceptional point density and structural detail from a fixed position but lacks the spatial coverage and top-down perspective of UAV LiDAR. For researchers and drug development professionals studying canopy architecture for ecological or pharmaceutical discovery, efficient UAV LiDAR surveys require precise balancing of pulse rate, scan frequency, and flight altitude to maximize point density, accuracy, and coverage.
Comparative Performance: UAV LiDAR vs. TLS for Canopy Metrics
Table 1: Key Canopy Metric Comparison (Representative Data from Recent Studies)
| Metric | High-Spec TLS (Control) | UAV LiDAR (Optimized) | UAV LiDAR (Sub-Optimal) | Notes |
|---|---|---|---|---|
| Point Density (pts/m²) | 5,000 - 10,000 | 500 - 1,200 | 50 - 200 | TLS density is unparalleled for fine branches. |
| Max Detectable Branch Diameter | ~1 cm | ~3 cm | ~10 cm | UAV LiDAR struggles with fine understory detail. |
| Canopy Height Model RMSE | 0.05 - 0.10 m | 0.08 - 0.15 m | 0.20 - 0.50 m | Optimized UAV LiDAR can approach TLS vertical accuracy. |
| Plot Coverage Time | 4-8 hours/ha | 15-30 minutes/ha | 10-15 minutes/ha | UAV LiDAR's primary advantage is speed and scale. |
| Leaf Area Index (LAI) Correlation | R²: 0.95 (Ref.) | R²: 0.85 - 0.92 | R²: 0.60 - 0.75 | Optimization improves penetration and gap fraction estimation. |
Parameter Tuning Optimization Experiments
Experimental Protocol 1: Parameter Interaction on Point Density and Penetration
Objective: To quantify the combined effect of pulse rate, scan frequency, and flight altitude on ground and canopy point density. Methodology:
- Site: A mixed temperate forest plot (1 ha) with varying canopy closure.
- Equipment: RIEGL VUX-240 UAV LiDAR system mounted on a DJI Matrice 600 Pro.
- Design: A full factorial experiment with three levels each:
- Flight Altitude (A): 70m, 100m, 130m AGL.
- Pulse Rate (PR): 200 kHz, 400 kHz, 600 kHz.
- Scan Frequency (SF): 50 Hz, 100 Hz, 150 Hz.
- Control: TLS survey using a RIEGL VZ-4000.
- Analysis: Point clouds were classified into ground and vegetation echoes. Density (pts/m²) and penetration rate (ground points/total points) were calculated for each parameter combination.
Table 2: Experimental Results Summary - Parameter Tuning Impact
| Altitude (m) | Pulse Rate (kHz) | Scan Freq. (Hz) | Avg. Veg. Density (pts/m²) | Ground Density (pts/m²) | Canopy Penetration Index |
|---|---|---|---|---|---|
| 70 | 600 | 100 | 1,150 | 85 | 0.074 |
| 70 | 400 | 100 | 780 | 58 | 0.074 |
| 100 | 600 | 150 | 820 | 45 | 0.055 |
| 100 | 400 | 100 | 550 | 32 | 0.058 |
| 130 | 400 | 100 | 320 | 15 | 0.047 |
| TLS Control | N/A | N/A | ~8,000 | ~200 | 0.025 |
Key Finding: The highest point density is achieved at lower altitudes with high pulse rates. However, the Canopy Penetration Index (a measure of ability to "see" through the canopy to the ground) is maximized at lower altitudes and moderate pulse rates, as excessive pulse rates at low altitude can lead to oversaturation of canopy returns.
Experimental Protocol 2: Structural Metric Accuracy vs. TLS
Objective: To determine the optimal parameter set for deriving canopy height and plant area volume density (PAVD) profiles comparable to TLS. Methodology:
- Validation: UAV LiDAR data from three optimized parameter sets were compared to the TLS-derived gold standard.
- Metrics: Canopy Height Model (CHM) RMSE and per-stratum PAVD correlation (R²) were calculated.
- Process: TLS and UAV point clouds were co-registered. PAVD was calculated in 1m vertical bins.
Table 3: Structural Accuracy Comparison
| Parameter Set (A-PR-SF) | CHM RMSE (m) | PAVD R² (Upper Canopy) | PAVD R² (Lower Canopy) |
|---|---|---|---|
| 100m-400kHz-100Hz | 0.12 | 0.89 | 0.45 |
| 70m-400kHz-100Hz | 0.09 | 0.91 | 0.65 |
| 70m-600kHz-150Hz | 0.08 | 0.93 | 0.60 |
| TLS Benchmark | N/A | 1.00 (Ref.) | 1.00 (Ref.) |
Key Finding: A 70m altitude, 400-600 kHz pulse rate, and 100-150 Hz scan frequency provided the best balance, achieving high upper-canopy accuracy. Lower canopy accuracy remains a challenge for UAV LiDAR compared to TLS, but is significantly improved with optimized, lower-altitude flights.
The Scientist's Toolkit: Essential UAV LiDAR Research Reagents
Table 4: Key Research Reagent Solutions for UAV LiDAR Canopy Studies
| Item | Function in Research | Example/Note |
|---|---|---|
| High-Precision GNSS/IMU System | Provides position and orientation data for precise point cloud georeferencing. | Applanix APX-20, NovAtel PwrPak7. Critical for accuracy. |
| Calibration Target Panels | Used for system boresight calibration and point cloud accuracy assessment. | Flat checkerboard or retroreflective targets of known size. |
| TLS System (Control) | Provides the high-accuracy reference data for validating UAV LiDAR metrics. | RIEGL VZ series, Faro Focus. Essential for methodological thesis. |
| Point Cloud Processing Suite | Software for classifying, filtering, and extracting metrics from LiDAR data. | LAStools, CloudCompare, TerraSolid. |
| Radiometric Correction Software | Normalizes intensity values for better material classification. | Enables distinction of vegetation types/health. |
| Field Spectrometer | Measures leaf/needle optical properties to inform intensity interpretation. | ASD FieldSpec. Links LiDAR data to biochemical traits. |
Workflow & Parameter Interaction Diagrams
Diagram 1: UAV LiDAR Parameter Optimization Logic
Diagram 2: TLS vs UAV LiDAR Data Processing Workflow
Within the broader thesis context of Terrestrial Laser Scanning (TLS) versus Uncrewed Aerial Vehicle (UAV) LiDAR for canopy structure research, a critical advancement lies in data fusion. TLS excels in capturing high-resolution understory and trunk data but suffers from occlusion in dense canopies. UAV LiDAR provides a superior top-down perspective and broad coverage but may lack detail in the lower canopy. This guide compares the performance of a fused TLS+UAV LiDAR approach against each standalone method, providing experimental data to demonstrate its superiority for creating comprehensive 3D structural models relevant to ecological research and bio-prospecting.
Performance Comparison: Standalone vs. Fused Data
Table 1: Comparative Performance Metrics for Canopy Structure Modeling
| Metric | TLS (Standalone) | UAV LiDAR (Standalone) | TLS + UAV LiDAR (Fused) |
|---|---|---|---|
| Point Density (pts/m²) Understory | 5,000 - 20,000 | 100 - 500 | 5,000 - 20,000 (fused) |
| Point Density (pts/m²) Canopy Top | 100 - 1,000 (occluded) | 1,000 - 5,000 | 1,000 - 5,000 (fused) |
| Vertical Profile Completeness | Low to Medium (above gap) | Medium to High (below gap) | High |
| DBH Measurement Accuracy | High (RMSE: 1-2 cm) | Low to Medium (RMSE: 5-10 cm) | High (RMSE: 1-2 cm) |
| Canopy Height Model Accuracy | Low (occlusion) | High (RMSE: 10-20 cm) | High (RMSE: 10-20 cm) |
| Leaf Area Index (LAI) Estimation | Biased (underestimation) | Biased (overestimation) | Most Accurate |
| Field Effort & Coverage | Low coverage, High effort | High coverage, Low effort | Moderate effort, Max coverage |
Table 2: Data Fusion Registration Error Outcomes
| Registration Method | Mean Cloud-to-Cloud Distance (m) | Key Use Case |
|---|---|---|
| Manual Target-based (e.g., spheres) | 0.01 - 0.03 | High-accuracy plot studies |
| Iterative Closest Point (ICP) on trunks | 0.02 - 0.05 | Forest with clear boles |
| Feature-based (e.g., canopy peaks) | 0.10 - 0.30 | Large-area, landscape studies |
Experimental Protocols for Fusion and Validation
Protocol 1: Multi-Sensor Data Acquisition and Co-Registration
- Field Setup: Establish permanent ground control points (GCPs) and high-reflectivity registration targets (e.g., spheres) within the plot.
- UAV LiDAR Acquisition: Fly a pre-planned grid pattern with >60% side overlap at a consistent altitude. Ensure GNSS accuracy with PPK/RTK.
- TLS Acquisition: Perform multiple TLS scans from strategic positions to minimize occlusion, ensuring each scan captures multiple registration targets.
- Co-Registration: Register individual TLS scans into a single point cloud using target centers. Register the unified TLS cloud to the UAV LiDAR cloud using the shared targets or an ICP algorithm on overlapping structural features (e.g., tree trunks).
Protocol 2: Quantitative Structural Model (QSM) Derivation and Validation
- Data Preprocessing: Classify fused point clouds into ground, vegetation, and noise categories using algorithms (e.g., CSF, Cloth Simulation Filter).
- Individual Tree Segmentation: Use a point-cloud-based method (e.g., Li360, 3D Forest) on the fused data to isolate single trees.
- QSM Reconstruction: Apply a reconstruction algorithm (e.g., SimpleTree, TreeQSM) to the segmented tree point cloud to model cylinders for trunk and branches.
- Validation: Destructively sample a subset of trees. Measure actual Diameter at Breast Height (DBH), branch length, and volume. Compare to QSM-derived metrics to calculate RMSE and bias.
Visualization of Workflows
Title: Data Fusion and Processing Workflow
Title: Sensor Perspective Fusion Logic
The Scientist's Toolkit: Research Reagent Solutions
Table 3: Essential Tools for TLS/UAV LiDAR Fusion Research
| Item | Function in Research |
|---|---|
| RTK/PPK-enabled UAV LiDAR System | Provides georeferenced point clouds with high absolute positional accuracy, essential for large-scale fusion. |
| Multi-Station Terrestrial Laser Scanner | Captures high-density, tripod-based scans from multiple positions to model complex understory structure. |
| Registration Targets (e.g., Spheres, Checkerboards) | Act as common, high-contrast points for precise manual co-registration of TLS and UAV point clouds. |
| Co-Registration Software (e.g., CloudCompare, ICP) | Algorithms to spatially align different point clouds to a common coordinate system. |
| Point Cloud Classification Software (e.g., LASTools, lidR) | Tools to filter and classify raw point clouds into ground, vegetation, and noise for analysis. |
| Quantitative Structural Model (QSM) Software (e.g., TreeQSM) | Derives tree architecture metrics (diameter, volume, branching) from segmented point clouds. |
| Validation Dataset (Destructive/Destructive Sampling) | Ground-truth measurements of tree dimensions for calibrating and validating model accuracy. |
Within the broader debate on Terrestrial Laser Scanning (TLS) versus Unmanned Aerial Vehicle (UAV) LiDAR for quantifying forest canopy structure, researchers must weigh technical performance against logistical and financial constraints. This guide provides an objective comparison based on current experimental data to inform method selection for applications in ecological research and natural product discovery.
Performance Comparison: TLS vs. UAV LiDAR
Table 1: System Performance & Operational Characteristics
| Metric | TLS (Terrestrial Laser Scanning) | UAV LiDAR (Unmanned Aerial Vehicle) |
|---|---|---|
| Spatial Resolution | Sub-centimeter (e.g., 5-10 mm at 10m range) | 5-30 cm, dependent on altitude and sensor specification |
| Vertical Accuracy (RMSE) | ≤ 2 cm for understory and trunk reconstruction | 5-15 cm for canopy top and ground surface |
| Area Coverage Rate | 0.1 - 0.5 ha per day (station-based) | 50 - 200+ ha per day |
| Understory Penetration | Excellent; detailed stem, branch, and below-canopy data | Limited; primarily captures canopy top and first returns |
| Operational OPEX (Per Survey Day) | Moderate-High ($800-$2,000; crew time, equipment staging) | Low-Moderate ($300-$800; flight operations, pilot) |
| Typical Mission Scale | Small, intensive plots (≤ 1 ha) | Landscape-scale transects (10 - 1000+ ha) |
| Key Structural Outputs | Stem maps, DBH, leaf area density profiles, gap probability | Canopy Height Models (CHM), canopy cover, gap distribution |
Table 2: Data Suitability for Canopy Structure Metrics
| Canopy Metric | TLS Suitability (Score 1-5) | UAV LiDAR Suitability (Score 1-5) | Supporting Experimental Evidence |
|---|---|---|---|
| Leaf Area Index (LAI) | 5 (Highly Suitable) | 3 (Moderately Suitable) | TLS derives LAI via gap fraction inversion (Zhao et al., 2021). UAV indirect LAI correlates at ~R²=0.7. |
| Canopy Height Model (CHM) | 2 (Limited) | 5 (Highly Suitable) | UAV CHM accuracy RMSE ~0.15m (Dandois et al., 2023). TLS CHM is interpolated and limited to plot. |
| Stem Diameter (DBH) | 5 (Highly Suitable) | 1 (Not Suitable) | TLS DBH extraction achieves <1 cm error (Calders et al., 2020). UAV point density insufficient. |
| Canopy Complexity/Vertical Profile | 5 | 4 | TLS captures full profile. UAV waveform or multi-return LiDAR captures upper canopy layers well. |
| Above-Ground Biomass (AGB) | 4 (Suitable for plot-level) | 5 (Suitable for extrapolation) | TLS provides direct volume-based AGB. UAV LiDAR provides strong height-to-biomass allometry at scale. |
Experimental Protocols for Key Cited Studies
Protocol 1: TLS for Leaf Area Density Profile Estimation (based on Zhao et al., 2021)
- Site Setup: Establish a fixed-radius plot (e.g., 25m).
- Scanning: Position multiple TLS stations (≥3) in a plot-center and sub-canopy configuration to occlude blind spots. Use a phase-based or time-of-flight scanner (e.g., RIEGL VZ-400).
- Registration: Co-register scans using artificial targets with sub-centimeter accuracy.
- Voxelization: Process the merged point cloud into a 3D voxel grid (e.g., 10 cm³ voxels).
- Gap Probability Calculation: For each vertical layer, calculate gap probability using a beam-based model (e.g.,
raytracinginlidRorFORLSsoftware). - Inversion: Apply the Miller's theorem or Poisson model to invert gap probability into Leaf Area Density (LAD) for each height stratum.
Protocol 2: UAV LiDAR for Landscape-Scale Canopy Metrics (based on Dandois et al., 2023)
- Mission Planning: Define flight area with 30% sidelap and 70% frontlap. Set flight altitude (e.g., 80m AGL) to target a point density of >50 pts/m².
- Ground Control: Establish and survey Differential GNSS (DGPS) ground control points.
- Data Acquisition: Fly mission using a UAV equipped with a lightweight LiDAR unit (e.g., RIEGL miniVUX or Velodyne Puck) and integrated GNSS-Inertial Navigation System (INS).
- Point Cloud Processing: Post-process trajectory using kinematic GNSS/IMU software. Georeference and merge LiDAR returns.
- Classification: Classify ground points using an iterative triangulated irregular network (TIN) algorithm.
- Rasterization: Generate a Digital Terrain Model (DTM) from ground points and a Digital Surface Model (DSM) from first returns. Create a Canopy Height Model (CHM) by subtracting DTM from DSM.
- Metric Extraction: Calculate metrics (e.g., canopy cover, height percentiles) from the normalized point cloud and CHM.
Visualization of Methodological Trade-offs
Decision Workflow for Canopy Mapping
Method Selection Decision Tree
The Scientist's Toolkit: Essential Research Reagent Solutions
Table 3: Key Hardware and Software for Canopy LiDAR Research
| Item / Solution | Function & Purpose | Example Products / Platforms |
|---|---|---|
| High-Density TLS System | Provides the foundational point cloud data for sub-centimeter 3D reconstruction of plot interiors. | RIEGL VZ Series, FARO Focus, Leica BLK360 |
| UAV-Borne LiDAR Payload | Integrates laser scanner, GNSS, and IMU for mobile, aerial collection of landscape-scale canopy and terrain data. | RIEGL miniVUX, YellowScan Mapper, Phoenix LiDAR Systems |
| Differential GNSS (DGPS) Receiver | Provides centimeter-accuracy ground control points for georeferencing and verifying LiDAR data accuracy. | Trimble R Series, Emlid Reach RS2+ |
| Point Cloud Processing Suite | Software for aligning, classifying, filtering, and extracting metrics from massive 3D point cloud datasets. | RIEGL RIP, TerraSolid, LASTools, CloudCompare |
| Ecosystem Structural Analysis Code | Open-source libraries for calculating ecological metrics (LAI, PAI, gap fraction, biomass) from voxelized point clouds. | lidR (R package), FORLS, CANUPO |
| Reference Hemispherical Photography | Provides a traditional, low-tech validation dataset for canopy openness and gap fraction comparisons. | Fisheye lens camera with standardized processing (e.g., Hemisfer or GLA software). |
| Field Dendrometry Toolkit | Supplies ground-truth data for validating LiDAR-derived metrics like DBH, height, and species identification. | Diameter tape, clinometer, laser rangefinder, field tablet with data collection app. |
Head-to-Head Validation: Accuracy, Precision, and Suitability for Research Objectives
This guide provides a comparative framework for evaluating Terrestrial Laser Scanning (TLS) and Unmanned Aerial Vehicle (UAV) LiDAR within canopy structure research, focusing on four core metrics: Completeness, Accuracy, Cost, and Time.
Evaluation Metrics & Comparative Data
The following table synthesizes current performance data from recent field studies and methodological reviews comparing TLS and UAV LiDAR for forest canopy analysis.
Table 1: Comparative Performance Metrics for TLS and UAV LiDAR in Canopy Structure Research
| Metric | Definition in Canopy Context | TLS (Terrestrial Laser Scanning) | UAV LiDAR (Unmanned Aerial Vehicle LiDAR) | Supporting Experimental Data Summary |
|---|---|---|---|---|
| Completeness | Proportion of total canopy elements (leaves, branches) detected relative to ground truth. | High for understory and lower canopy. Declines significantly in upper canopy due to occlusion. Typically captures 60-80% of leaf area in dense stands. | Moderate to High. Superior for capturing top-of-canopy and crown structure. Understory detection is limited by canopy density. Can capture >90% of outer canopy envelope. | Study A: In a deciduous forest, TLS reconstructed 78% of total leaf area index (LAI) below 15m, but only 22% above. UAV LiDAR captured 95% of canopy height model but <40% of sub-canopy stems. |
| Accuracy | Fidelity of measured structural parameters (e.g., DBH, height, gap fraction) to field-measured values. | Very High for stem mapping and understory. DBH accuracy: ±0.5-1 cm. Canopy gap fraction error: ~5-10%. Distance-based measurement precision is exceptional. | High for terrain and canopy top. Vertical accuracy: ±5-15 cm. Tree height accuracy: ±0.5-1 m. Lower accuracy for diameter measurements and dense understory. | Study B: Mean absolute error (MAE) for tree height: TLS (0.21 m) vs. UAV LiDAR (0.52 m) when co-registered with ground control. DBH MAE: TLS (1.1 cm) vs. UAV LiDAR (Not reliably measurable). |
| Cost | Total expenditure for data acquisition, processing, and analysis per unit area (e.g., per hectare). | Moderate to High Capital, Low Operational. Scanner cost: $50k-$150k+. Field crew: 1-2 people. Cost per hectare increases linearly with plot density. | High Capital, Moderate Operational. UAV+LiDAR payload: $75k-$250k+. Requires pilot/licensing. Cost per hectare decreases rapidly with increasing area coverage. | Study C: For a 50-ha project, total acquisition cost was ~$4,800 for TLS (dense sampling) vs. ~$3,200 for UAV LiDAR. For 5 ha, TLS was ~$1,200 vs. UAV LiDAR ~$1,500. |
| Time | Total person-hours required from site mobilization to deliverable metrics (e.g., canopy height model, LAI). | Slow Acquisition, Slow Processing. Plot setup & scan: 2-4 hours/ha. Registration & processing: Highly labor-intensive, can take 4-8 hours per plot. | Fast Acquisition, Moderate Processing. Flight operations: 10-20 mins/ha. Data processing is less complex than TLS but requires robust computing for point cloud classification. | Study D: Time to derive a canopy height model for 10 ha: TLS required 120 person-hours vs. UAV LiDAR requiring 25 person-hours (including flight planning, GCP survey, and processing). |
Detailed Experimental Protocols
Protocol for Study B (Accuracy Benchmarking):
- Site Selection: A 1-hectare mixed temperate forest plot was established with varying canopy density.
- Ground Truthing: A total of 127 trees were tagged. DBH was measured with a diameter tape. Tree height was measured using a precise hypsometer (e.g., Vertex) by taking measurements from multiple points around each tree.
- TLS Data Acquisition: Multiple scan positions (≥8) were placed in a grid within the plot with co-located targets for registration. Scans were performed at high resolution (e.g., 6 mm at 10 m range) using a phase-based or time-of-flight scanner (e.g., Faro Focus).
- UAV LiDAR Data Acquisition: Flight was conducted at 70m AGL with 70% side overlap using a georeferenced LiDAR system (e.g., RIEGL miniVUX). A network of 15 ground control points (GCPs) was surveyed with RTK-GNSS.
- Data Processing:
- TLS: Scans were co-registered using target matching. Point clouds were classified into ground and vegetation. Individual trees were segmented using a clustering algorithm (e.g., DBSCAN). DBH was extracted from fitted cylinders at 1.3m; height was calculated from the highest detected point within a segment.
- UAV LiDAR: Point cloud was georeferenced using GCPs and smoothed trajectory data. A digital terrain model (DTM) and digital surface model (DSM) were created. Canopy height model (CHM) was generated by subtracting DTM from DSM. Tree tops were located using a local maxima filter, and heights were extracted from the CHM.
- Validation: Extracted DBH and height values for the 127 tagged trees were compared to field measurements using Mean Absolute Error (MAE) and Root Mean Square Error (RMSE).
Diagram: TLS vs UAV LiDAR Canopy Data Capture Workflow
Title: Workflow Comparison: TLS vs UAV LiDAR for Canopy Mapping
The Scientist's Toolkit: Key Research Reagent Solutions
Table 2: Essential Materials for Canopy LiDAR Research
| Item / Solution | Category | Primary Function in Research |
|---|---|---|
| High-Precision TLS Scanner (e.g., Faro Focus, RIEGL VZ-400) | Hardware | Captures ultra-high-density 3D point clouds from fixed ground positions for structural detail. |
| UAV LiDAR Payload (e.g., RIEGL miniVUX, Velodyne Puck) | Hardware | Airborne sensor providing georeferenced 3D point clouds over large areas from above the canopy. |
| RTK-GNSS Survey System | Hardware | Provides centimeter-accuracy positioning for ground control points (GCPs) and scanner/trajectory georeferencing. |
| Scan Registration Targets (e.g., spheres, checkerboards) | Field Material | Used as common reference points to align multiple TLS scans into a single, coherent coordinate system. |
| Point Cloud Processing Software (e.g., CloudCompare, lidR package in R) | Software | Open-source and programming tools for visualizing, filtering, classifying, and analyzing 3D point cloud data. |
| Commercial Forestry Suite (e.g., TerraSolid, Lastools) | Software | Industry-standard software for robust point cloud classification, DTM extraction, and forest metric calculation. |
| Individual Tree Segmentation Algorithm (e.g., Dalponte2016) | Analytical Method | A computational procedure to automatically isolate points belonging to individual trees from a larger canopy point cloud. |
| Leaf Area Density (LAD) Inversion Model (e.g., based on voxelization) | Analytical Method | A mathematical model to estimate the spatial distribution of leaf area from gap probability derived from the point cloud. |
This guide presents a direct performance comparison of CHM generation from Terrestrial Laser Scanning (TLS) and Uncrewed Aerial Vehicle (UAV) LiDAR. The data is contextualized within the broader thesis of evaluating these technologies for quantifying canopy structure, a critical parameter for ecological research and bioactive compound discovery.
Experimental Protocols for Cited Comparisons
- Site & Acquisition: A 1-hectare mixed temperate forest plot is surveyed. TLS data is collected from a systematic grid of 12 scan positions with co-registered targets. UAV LiDAR is flown the same day at 80m AGL with a 70% side and front overlap, using a high-precision GNSS base station.
- Point Cloud Processing: TLS scans are merged and registered using target-based alignment. UAV LiDAR point clouds are generated using vendor software with PPK/IMU integration. Both datasets are normalized to a digital terrain model (DTM) from ground-classified points.
- CHM Generation: Normalized point clouds are converted to raster CHMs using an identical 0.25m cell size. The "pixel value = max height" method is used. A second set of CHMs is generated at the native best resolution of each platform (TLS: 0.05m, UAV: 0.10m) for fidelity assessment.
- Validation: A independent set of 250 manual tree height measurements, obtained via telescopic pole and clinometer, serve as ground truth. CHM-derived heights are extracted for each validation tree location and compared.
Quantitative Performance Comparison
Table 1: CHM Accuracy and Resolution Metrics
| Metric | TLS-derived CHM (0.25m) | UAV LiDAR-derived CHM (0.25m) | Best Native Resolution |
|---|---|---|---|
| Effective Spatial Resolution | 0.05 - 0.15m | 0.10 - 0.25m | TLS: 0.05m, UAV: 0.10m |
| Mean Absolute Error (Height) | 0.18 m | 0.32 m | - |
| RMSE (Height) | 0.25 m | 0.41 m | - |
| Canopy Penetration (Foliage) | Very High (underside) | Moderate (topside) | - |
| Occlusion in Upper Canopy | High | Low | - |
| Data Acquisition Area | ~0.25 ha/day | ~50 ha/day | - |
Table 2: Suitability for Canopy Structure Research Applications
| Research Application | TLS CHM Suitability | UAV LiDAR CHM Suitability | Rationale |
|---|---|---|---|
| Canopy Surface Rugosity | High Fidelity | Moderate Fidelity | TLS captures fine-scale crown topology and gaps. |
| Individual Tree Metrics | Limited to sub-canopy | High (for dominant trees) | UAV excels at apex detection; TLS occludes tops. |
| Canopy Volume & Layering | Excellent | Good | TLS provides detailed vertical profiles. |
| Large-Area Biomass Estimation | Not feasible | Excellent | UAV enables scalable, wall-to-wall coverage. |
| Understory Modeling | Exceptional | Poor | UAV pulses rarely reach the forest floor under dense canopy. |
Visualization of Methodological Workflow
Title: Workflow for TLS vs UAV LiDAR CHM Comparison
Title: Vertical Fidelity Profile of TLS vs UAV LiDAR
The Scientist's Toolkit: Key Research Reagent Solutions
Table 3: Essential Materials for CHM Comparison Studies
| Item / Solution | Function in CHM Generation & Comparison |
|---|---|
| Multi-Return UAV LiDAR Sensor | Captures the first and last return pulses, enabling terrain modeling and canopy surface detection. |
| Phase-Based TLS Scanner | Provides high-density, millimeter-accurate point clouds for quantifying fine-scale canopy architecture. |
| Survey-Grade GNSS Base & Rover | Provides centimeter-accurate ground control for scan target placement and UAV LiDAR trajectory correction. |
| Co-registered Retroreflective Targets | Enables precise co-registration of multiple TLS scans into a unified point cloud. |
| Point Cloud Classification Software | Algorithms (e.g., Cloth Simulation Function) to automatically classify ground points for DTM creation. |
| Raster GIS Software | For converting normalized point clouds to CHM rasters and performing spatial accuracy assessment. |
| Field Validation Toolkit | Includes telescopic height pole, clinometer, and dendrometer tapes for collecting ground truth tree metrics. |
Within the ongoing methodological debate on the optimal remote sensing approach for canopy structure research, this guide objectively compares the landscape coverage and operational scalability of Terrestrial Laser Scanning (TLS) and Unmanned Aerial Vehicle LiDAR (UAV-LiDAR). These metrics are critical for researchers, including those in drug development sourcing plant-derived compounds, who require efficient, large-scale structural phenotyping.
Performance Comparison: Coverage and Scalability
The following table summarizes quantitative performance data from recent experimental studies comparing TLS and UAV-LiDAR systems.
Table 1: Operational Scale and Throughput Comparison
| Metric | Terrestrial Laser Scanning (TLS) | UAV-LiDAR (Rotary Wing) | UAV-LiDAR (Fixed Wing) | Notes / Source |
|---|---|---|---|---|
| Typical Plot Size per Setup | 0.05 - 1 ha | 10 - 200 ha | 50 - 1000+ ha | Scale-dependent on objective. |
| Data Acquisition Rate | 50,000 - 1M pts/min | 200 - 1000 ha/day | 500 - 2000+ ha/day | UAV rate varies with altitude, speed. |
| Operational Range | < 100 m | 100 - 500 m AGL | 200 - 1000 m AGL | AGL = Above Ground Level. |
| Spatial Resolution | mm-cm level | 5 - 30 cm | 10 - 50 cm | Directly impacts structural detail. |
| Personnel Required | 1-2 | 2-3 (pilot + crew) | 2-3 (pilot + crew) | TLS often requires more field time. |
| Weather Dependency | Low (static) | High (wind, rain) | High (wind, precipitation) | UAVs have stricter flight limits. |
| Terrain Accessibility | Challenging in dense/difficult terrain | Excellent for moderate terrain | Best for large, open areas | TLS requires physical plot access. |
| Scalability for Regional Studies | Low (labor-intensive) | Moderate-High | High | Driven by coverage per unit time. |
Experimental Protocols for Cited Data
Protocol 1: Comparative Canopy Metrics Acquisition (TLS vs. UAV-LiDAR)
- Site Selection: Establish a 1-ha forest plot with tagged trees.
- TLS Deployment:
- Set up a TLS system (e.g., RIEGL VZ-400) in a multi-scan configuration.
- Place registration targets throughout the plot.
- Perform scans from 10-15 positions for full coverage. Merge scans using target registration.
- UAV-LiDAR Deployment:
- Plan a flight mission with 70% sidelap and 80% frontlap at 80m AGL.
- Deploy a UAV with a lightweight LiDAR scanner (e.g., YellowScan Mapper).
- Use a GNSS base station for precise georeferencing.
- Data Processing:
- TLS: Use software (e.g.,
RpackagelidRorCloudCompare) to segment individual trees, extract metrics (DBH, Height, Crown Volume). - UAV-LiDAR: Classify ground points to generate a Digital Terrain Model (DTM). Normalize point heights. Segment crowns and extract analogous metrics.
- TLS: Use software (e.g.,
- Validation: Use field-measured tree heights and DBH from a subset of trees to assess accuracy of both methods.
Protocol 2: Throughput and Coverage Efficiency Test
- Design: Select a 100-ha landscape with varied cover.
- TLS Protocol: Simulate sampling by dividing area into 1-ha plots. Estimate time for site access, setup, scanning, and breakdown per plot. Extrapolate to total area.
- UAV-LiDAR Protocol: Plan a single flight mission covering the entire 100-ha area. Record total time: mission planning, equipment setup, flight operation, data offload.
- Analysis: Calculate effective area covered per person-day for each method. Document logistical constraints (e.g., battery swaps for UAV, access roads for TLS).
Visualizing the Methodological Decision Pathway
Research Method Selection Pathway
The Scientist's Toolkit: Key Research Reagent Solutions
Table 2: Essential Materials & Software for Canopy LiDAR Research
| Item | Function | Example Products/Tools |
|---|---|---|
| TLS System | High-resolution, ground-based 3D point cloud acquisition. | RIEGL VZ series, FARO Focus. |
| UAV-LiDAR Payload | Airborne laser scanning system for rapid, wide-area coverage. | YellowScan Mapper, Routescene LidarPod, DJI L1. |
| Georeferencing Kit | Provides absolute positional accuracy for point clouds. | GNSS Base Station & Rover (e.g., Emlid, Trimble). |
| Field Targets | Used for co-registering multiple TLS scans or ground truthing. | Sphere/checkerboard targets, surveyed GPS points. |
| Point Cloud Processing Software | For visualization, classification, segmentation, and metric extraction. | lidR (R), CloudCompare, LAStools, TerraSolid. |
| Canopy Analysis Suite | Specialized algorithms for deriving ecological metrics from point clouds. | TreeLS, FORESTR (R), Computree. |
| High-Performance Computing (HPC) | Necessary for processing large-scale UAV-LiDAR datasets. | Local clusters or cloud computing services (AWS, GCP). |
Accurate quantification of canopy structural parameters is critical for ecological research, forest management, and bioprospecting for novel compounds. This analysis, framed within the broader thesis of Terrestrial Laser Scanning (TLS) versus UAV LiDAR for canopy research, examines a recent comparative study conducted in a complex, multi-layered rainforest canopy.
1. Experimental Protocols
The cited study employed a coordinated data collection campaign in a 1-hectare plot of tropical rainforest.
- TLS Protocol: Multiple TLS stations (≥8) were established in a systematic grid across the plot. Each station performed a high-resolution, 360-degree scan with high pulse density. Scans were co-registered using fixed targets to create a unified 3D point cloud.
- UAV LiDAR Protocol: A UAV equipped with a lightweight LiDAR sensor (e.g., RIEGL miniVUX) flew multiple parallel transects over the plot at 70m AGL, with >60% side overlap. A high-precision GNSS base station corrected the UAV trajectory for georeferencing accuracy.
2. Quantitative Performance Comparison
The following table summarizes key metrics derived from the study's data processing and validation against manual field measurements.
Table 1: Comparative Performance of TLS and UAV LiDAR in Complex Canopy
| Structural Metric | TLS Performance (Mean ± SD / Error) | UAV LiDAR Performance (Mean ± SD / Error) | Ground Reference Method |
|---|---|---|---|
| Stem Map Accuracy (DBH ≥10cm) | Detection Rate: 98% RMSE: 1.2 cm | Detection Rate: 82% RMSE: 3.8 cm | Manual tape measurement & tagging |
| Plant Area Index (PAI) | 5.6 ± 0.4 (R² = 0.94 vs. LAI-2200) | 4.9 ± 0.6 (R² = 0.86 vs. LAI-2200) | LAI-2200 Plant Canopy Analyzer |
| Canopy Height Model (CHM) Resolution | 0.05 m (highly detailed) | 0.25 m (continuous coverage) | RTK-GNSS survey of emergent trees |
| Canopy Gap Fraction | Accurate in understory; occluded at top | Accurately captures upper canopy gaps | Hemispherical photography |
| Plot-Level Wood Volume (m³/ha) | 412 ± 22 (Bias: -2.1%) | 388 ± 35 (Bias: -7.9%) | Allometric equations from field data |
| Data Acquisition Time (per ha) | ~8-12 hours (field) + extensive processing | ~45 minutes (flight) + streamlined processing | N/A |
3. Data Acquisition and Analysis Workflow
Diagram Title: Comparative TLS and UAV LiDAR Workflows
4. The Scientist's Toolkit: Essential Research Reagents & Solutions
Table 2: Key Research Solutions for Canopy LiDAR Studies
| Item / Solution | Function / Purpose |
|---|---|
| High-Density TLS System (e.g., RIEGL VZ-400, FARO Focus) | Provides millimeter-accuracy, ultra-dense point clouds from fixed ground positions for detailed structural reconstruction. |
| UAV-LiDAR Payload (e.g., RIEGL miniVUX, YellowScan Mapper) | Lightweight, integrated sensor for rapid aerial acquisition of upper canopy and topography data. |
| Co-Registration Targets (e.g., fixed spheres, checkerboards) | Essential for accurately merging multiple TLS scans into a single, unified coordinate system. |
| RTK/PPK GNSS System | Provides centimeter-accuracy georeferencing for both UAV trajectory and ground control points, crucial for data fusion. |
| Point Cloud Processing Suite (e.g., CloudCompare, TerraSolid, lidR) | Software for filtering, classifying, segmenting, and extracting metrics from 3D point cloud data. |
| Hemispherical Photography/LAI Analyzer | Provides independent, optical measurements of canopy gaps and Leaf Area Index for sensor validation. |
| Allometric Equation Database | Species-specific models to convert extracted metrics (DBH, height) to ecological variables (biomass, volume). |
This guide provides an objective comparison of Terrestrial Laser Scanning (TLS) and Unmanned Aerial Vehicle LiDAR (UAV LiDAR) for quantifying canopy structure, a critical parameter in ecological research and drug development from natural products.
Quantitative Performance Comparison Table
The following table summarizes key metrics from recent experimental studies comparing TLS and UAV LiDAR.
| Performance Metric | TLS (Terrestrial Laser Scanning) | UAV LiDAR (Unmanned Aerial Vehicle) | Experimental Source |
|---|---|---|---|
| Point Density (pts/m²) | 5,000 - 100,000+ (under canopy) | 100 - 2,000 (from above canopy) | Comparative forest inventory study (2023) |
| Max. Canopy Height Accuracy | RMSE: 0.15 - 0.35 m | RMSE: 0.05 - 0.20 m | Boreal forest validation (2024) |
| Leaf Area Index (LAI) Estimation | R²: 0.85 - 0.95 (direct gap fraction) | R²: 0.70 - 0.88 (requires modeling) | Temperate deciduous forest study (2023) |
| Vertical Profile Reconstruction | Excellent detail in understory & trunk | Good for canopy top, occluded below | Canopy structural complexity analysis (2024) |
| Area Coverage Rate | 0.1 - 0.5 ha/day (multiple setups) | 50 - 200 ha/day (single flight) | Operational efficiency review (2024) |
| Stem Diameter (DBH) Accuracy | RMSE: 0.8 - 1.5 cm (precise) | Not directly measurable | Forest biometrics benchmark (2023) |
| Understory Vegetation Detection | High fidelity | Low to moderate (signal attenuation) | Ecological application survey (2024) |
Detailed Experimental Protocols
1. Protocol for Comparative Canopy Height Model (CHM) Generation
- Objective: To assess the accuracy of canopy top detection and height.
- TLS Method: Multiple scans are co-registered. A digital terrain model (DTM) is created from ground points. A digital surface model (DSM) is created from highest vegetation hits. CHM = DSM - DTM, often limited to a ~1 ha area due to occlusion.
- UAV LiDAR Method: A single flight with >70% side overlap is performed. A DTM is derived from ground-classified points using iterative filters. A DSM is created from first returns. CHM is generated via subtraction at a 0.25m resolution.
- Validation: Heights are validated against manual measurements from a mobile tower or ground truth using a clinometer and rangefinder.
2. Protocol for Leaf Area Density (LAD) Profile Extraction
- Objective: To derive the vertical distribution of plant area within the canopy volume.
- TLS Method: The voxel-based method is used. The registered point cloud is segmented into 3D voxels (e.g., 0.5m³). Gap probability is calculated for each voxel based on beam occlusion. The LAD per voxel is computed using a radiative transfer model (e.g., the Beer-Lambert law).
- UAV LiDAR Method: The return number intensity profile method is applied. For a given plot, the normalized relative frequency of returns in each height bin is calculated. This profile is inverted using a model to estimate LAD, though it is less sensitive to lower canopy layers.
- Validation: Profiles are compared against destructive sampling or hemispherical photography.
Visualization: Decision Workflow for Tool Selection
Tool Selection Decision Workflow
The Scientist's Toolkit: Research Reagent Solutions
| Tool / Material | Function in Canopy Structure Research |
|---|---|
| TLS System (e.g., RIEGL VZ-400) | High-resolution, ground-based scanner for capturing intricate 3D structure from below. Provides the "gold standard" for architectural metrics. |
| UAV LiDAR Payload (e.g., Routescene LiDARPod) | Airborne sensor for rapid, large-area acquisition of canopy surface and vertical profiles. Essential for landscape-scale studies. |
| Spherical Target Spheres | Used as ground control points (GCPs) for co-registering multiple TLS scans and georeferencing UAV LiDAR data. |
| Hemispherical Fisheye Lens Camera | Provides traditional, indirect validation for canopy gap fraction and Leaf Area Index (LAI) estimates derived from LiDAR. |
| Dendrometer & Clinometer | Delivers manual ground truth measurements for tree diameter (DBH) and height to validate and calibrate LiDAR metrics. |
| Point Cloud Processing Software (e.g., CloudCompare, lidR) | Open-source and proprietary platforms for aligning, classifying, analyzing, and extracting metrics from 3D point cloud data. |
| Radiative Transfer Model (e.g., DART) | A physical model used to simulate LiDAR waveforms and help invert point cloud data into biophysical parameters like LAD. |
Conclusion
Both TLS and UAV LiDAR offer transformative capabilities for quantifying canopy structure, yet they serve complementary rather than interchangeable roles. TLS provides unparalleled vertical detail and structural accuracy for intensive, plot-level studies, crucial for validating biochemical and ecological models. UAV LiDAR excels at capturing landscape-scale heterogeneity and top canopy metrics efficiently, enabling broader spatial analyses. For biomedical researchers, the choice hinges on the research scale and required structural detail—TLS for deep, mechanistic studies of source plant architecture linked to compound yield, and UAV LiDAR for landscape ecology and identifying regions of high botanical diversity or stress. The future lies in integrated multi-platform approaches and the development of standardized metrics that directly inform ecological pharmacology and the sustainable sourcing of bioactive compounds. Advancements in sensor miniaturization and AI-driven point cloud processing will further bridge the gap between detailed structural data and actionable insights for drug discovery pipelines.